Exam 4: Relationships Between Categorical Variables
Exam 1: Statistics Success Stories and Cautionary Tales79 Questions
Exam 2: Turning Data Into Information94 Questions
Exam 3: Relationships Between Quantitative Variables99 Questions
Exam 4: Relationships Between Categorical Variables100 Questions
Exam 5: Sampling: Surveys and How to Ask Questions109 Questions
Exam 6: Gathering Useful Data for Examining Relationships90 Questions
Exam 7: Probability112 Questions
Exam 8: Random Variables115 Questions
Exam 9: Understanding Sampling Distributions: Statistics As Random Variables231 Questions
Exam 10: Estimating Proportions With Confidence104 Questions
Exam 11: Estimating Means With Confidence103 Questions
Exam 12: Testing Hypotheses About Proportions139 Questions
Exam 13: Testing Hypotheses About Means166 Questions
Exam 14: Inference About Simple Regression115 Questions
Exam 15: More About Inference for Categorical Variables111 Questions
Exam 16: Analysis of Variance111 Questions
Exam 17: Turning Information Into Wisdom70 Questions
Select questions type
Use the following information for questions:
Students in a statistics class were asked, "With whom do you find it easier to make friends: person of the same sex, person of opposite sex, or no preference?" A table summarizing the responses by gender is given below. Minitab results for a chi-square test for these data were "Chi-Sq = 7.15 DF=2 P-value = 0.028." 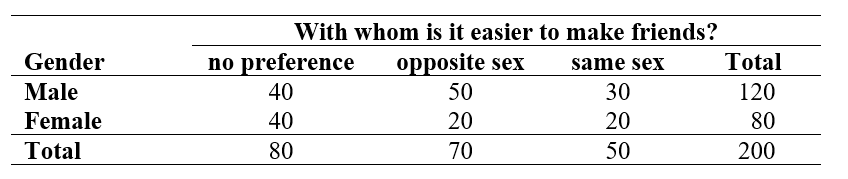 -Assume these students represent a random sample of all students. Based on the chi-square test, what conclusion can be made about the relationship between gender and response to the question about friends, using = 0.05?
Free
(Multiple Choice)
4.8/5  (33)
(33)
Correct Answer: Verified
D
Use the following information for questions:
A survey asked people how often they exceed speed limits. The data are then categorized into the following contingency table of counts showing the relationship between age group and response. 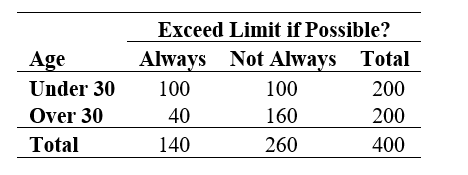 -Among people with age over 30, what's the "risk"of always exceeding the speed limit?
Free
(Multiple Choice)
4.9/5 (39)
Correct Answer:Verified
A
Use the following information for questions:
The table below summarizes, by gender of respondent, the responses from 1,033 people to the question, "Do you smoke?" 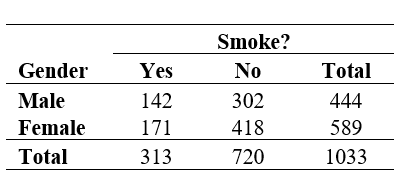 -What are the odds of smoking (to not smoking) for a woman?
Free
(Multiple Choice)
5.0/5 (36)
Correct Answer:Verified
C
A chi-square test involves a set of counts called "expected counts." What are the expected counts?
(Multiple Choice)
4.8/5 (42)
The tables below show the financial aid results by gender for each program.
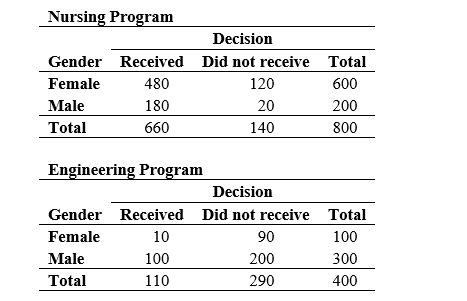 -For the engineering program, what are the percentages of females and of males that received some sort of financial aid?
(Short Answer)
4.8/5 (37)
Use the following information for questions:
A researcher conducted a study on college students to see if there was a link between gender and how often they have cheated on an exam. She asked two questions on a survey:
(1) What is your gender? Male ___ Female ___
(2) How many times have you cheated on an exam while in college?
Never __ 1 or 2 times ___ 3 or more times ___
A two-way table of observed counts follows:
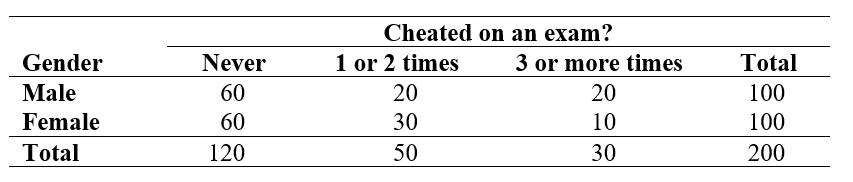 Chi-Square = 5.33, DF = 2, P-Value = 0.0696
-Based on the chi-square statistic and p-value, what conclusion can be made about the relationship between gender and response to the question about cheating, using = 0.05?
Chi-Square = 5.33, DF = 2, P-Value = 0.0696
-Based on the chi-square statistic and p-value, what conclusion can be made about the relationship between gender and response to the question about cheating, using = 0.05?
(Multiple Choice)
4.8/5 (29)
Use the following information for questions:
The table below shows the number of Olympic medals won by the three countries with the most medals during the 2000 Olympics in Sydney, Australia. There were a total of 244 medals won by the three countries. 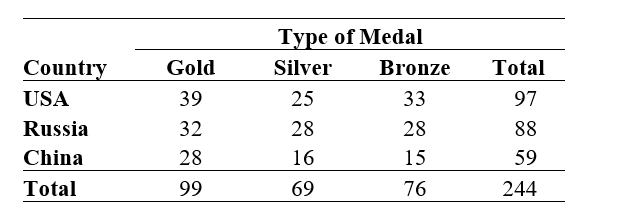 -What percent of the medals won among the three countries were won by the USA?
(Multiple Choice)
4.9/5 (36)
Use the following information for questions:
The table below shows the opinions of 1027 respondents in the General Social Survey to the question "Everything considered, would you say that in general, you approve or disapprove of wiretapping?" The purpose of examining the data is to see if there is a gender difference in how people would respond to this question. 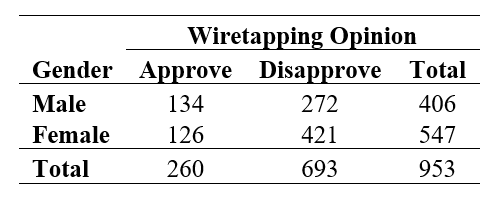 -To test whether there is a relationship in the population between gender and support for wiretapping, the chi-square statistic = 11.7 and the p-value = 0.001. Are the results statistically significant or not statistically significant? State your conclusion.
(Short Answer)
4.8/5 (37)
Use the following information for questions:
The table below shows the number of Olympic medals won by the three countries with the most medals during the 2000 Olympics in Sydney, Australia. There were a total of 244 medals won by the three countries.
-What percent of the medals won among the three countries were gold?
(Multiple Choice)
4.7/5 (33)
Use the following information for questions:
The table below shows the opinions of 1027 respondents in the General Social Survey to the question "Everything considered, would you say that in general, you approve or disapprove of wiretapping?" The purpose of examining the data is to see if there is a gender difference in how people would respond to this question.
-State the null and alternative hypotheses for this study.
(Short Answer)
4.8/5 (30)
Use the following information for questions:
The table below shows the opinions of 1447 respondents in the General Social Survey to the question "Do you favor or oppose the death penalty for persons convicted of murder?" The purpose of examining the data is to see if there is a gender difference in how people would respond to this question. 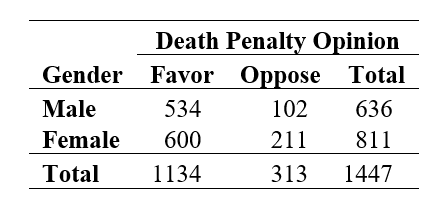 -Assuming the null hypothesis is true, calculate the expected number of men in the sample who would favor the death penalty.
(Short Answer)
4.8/5 (25)
If the relative risk of having an accident while eating when driving (compared to not eating) is 5, and the risk of having an accident when not eating is 1 in 10000, then the risk of having an accident while eating is:
(Multiple Choice)
4.9/5 (47)
Use the following information for questions:
The table below shows the number of Olympic medals won by the three countries with the most medals during the 2000 Olympics in Sydney, Australia. There were a total of 244 medals won by the three countries.
-What percent of the medals won by the USA were gold?
(Multiple Choice)
4.8/5 (32)
In a newspaper article about whether the regular use of Vitamin C reduces the risk of getting a cold, a researcher is quoted as saying that Vitamin C performed better than placebo in an experiment, but the difference was not larger than what could be explained by chance. In statistical terms, the researcher is saying the results are _______
(Multiple Choice)
4.9/5 (31)
Use the following information for questions:
The table below shows the responses from a sample of 680 people in the General Social Survey to the question, "Do you sometimes drink more than you think you should?" 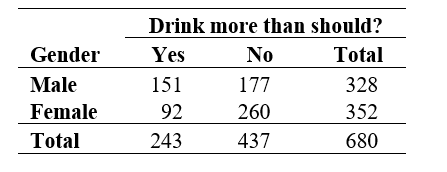 -What is the risk (or percentage) of women thinking they drank more than they should?
(Multiple Choice)
4.7/5 (37)
Use the following information for questions:
A newspaper article reported that "Children who routinely compete in vigorous after-school sports on smoggy days are three times more likely to get asthma than their non-athletic peers."(Sacramento Bee, Feb 1, 2002, p. A1)
-The newspaper also reported that "The number of children in the study who contracted asthma was relatively small - 265 of 3,535."From this information and the information given in the original quote, which of the following could not be computed?
(Multiple Choice)
4.8/5 (39)
Use the following information for questions:
The table below shows the ratings given by 200 students in an introductory statistics course. There were two instructors for the course, each with 100 students. 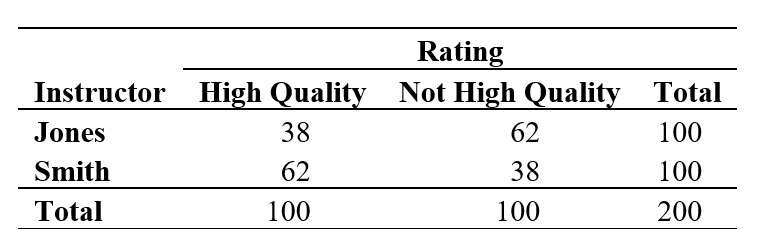 -Which phrases best complete this sentence? Those students who are ____________ at math generally gave higher instructor ratings and instructor __________ had a higher percentage of these type of students, giving the inaccurate impression that this instructor was best overall.
(Multiple Choice)
4.8/5 (37)
Use the following information for questions:
The table below shows the ratings given by 200 students in an introductory statistics course. There were two instructors for the course, each with 100 students.
-Which instructor has the highest percentage of high quality teaching ratings?
(Multiple Choice)
4.7/5 (45)
Use the following information for questions:
In a survey of 1000 adults, respondents were asked about the expense of a college education and the relative necessity of financial assistance. The correspondents were classified as to whether they currently had a child in college or not (college status), and whether they thought the loan obligation for most college students was too high, about right, or too little (loan obligation opinion). The table below summarizes some of the survey results. Use these results to answer the following questions.
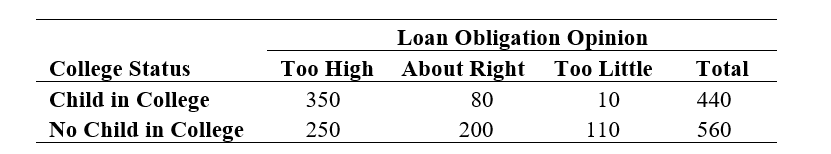 -What percent of adults with a child in college surveyed think loan obligations are too high?
(Short Answer)
4.8/5 (31)
Use the following information for questions:
A survey asked people how often they exceed speed limits. The data are then categorized into the following contingency table of counts showing the relationship between age group and response.
-Among people with age under 30 what are the odds that they always exceed the speed limit?
(Multiple Choice)
4.8/5 (42)
Filters
- Essay(0)
- Multiple Choice(0)
- Short Answer(0)
- True False(0)
- Matching(0)