Exam 16: Analysis of Variance
Exam 1: Statistics Success Stories and Cautionary Tales79 Questions
Exam 2: Turning Data Into Information94 Questions
Exam 3: Relationships Between Quantitative Variables99 Questions
Exam 4: Relationships Between Categorical Variables100 Questions
Exam 5: Sampling: Surveys and How to Ask Questions109 Questions
Exam 6: Gathering Useful Data for Examining Relationships90 Questions
Exam 7: Probability112 Questions
Exam 8: Random Variables115 Questions
Exam 9: Understanding Sampling Distributions: Statistics As Random Variables231 Questions
Exam 10: Estimating Proportions With Confidence104 Questions
Exam 11: Estimating Means With Confidence103 Questions
Exam 12: Testing Hypotheses About Proportions139 Questions
Exam 13: Testing Hypotheses About Means166 Questions
Exam 14: Inference About Simple Regression115 Questions
Exam 15: More About Inference for Categorical Variables111 Questions
Exam 16: Analysis of Variance111 Questions
Exam 17: Turning Information Into Wisdom70 Questions
Select questions type
Use the following information for questions:
The following four graphs are profile plots obtained from a two-way analysis of variance where the response was compared between gender (male/female) and answer (yes/no). 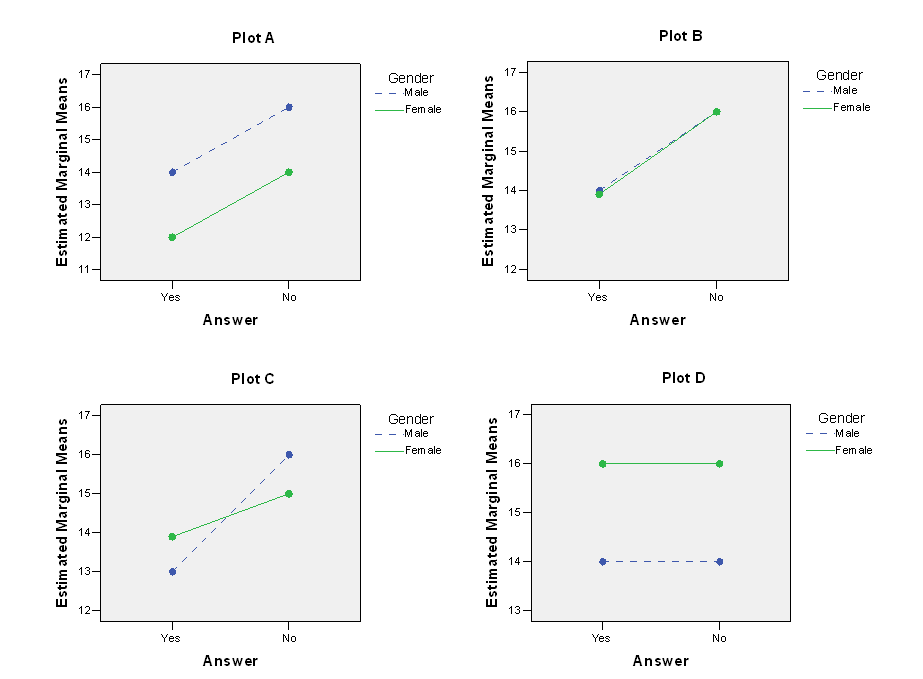 -Which of the four plots show a main effect for one factor but not for the other factor?
Free
(Multiple Choice)
4.7/5  (38)
(38)
Correct Answer: Verified
D
Use the following information for questions:
A random sample of 235 students from University X is given a questionnaire about feelings. One of the questions was: "How do you feel about your height?" The answer categories were: too short, just about right, or too tall. A total feelings score is also calculated to measure the students' self worth. The results of theself worth score will be compared between the three groups defined by their feelings about their height andbetween boys and girl. The F-ratio for the interaction between feelings about height and gender is 4.98, with a p-value of 0.008.
-Which null hypothesis is tested by the test statistic F = 4.98?
Free
(Multiple Choice)
4.8/5 (34)
Correct Answer:Verified
C
Use the following information for questions:
A supervisor wants to study the relationship between employee training and time required to complete a job-related task. Three levels of employee training are considered: Beginner, Intermediate, and Advanced. Thirty new employees were randomly selected and each employee was randomly assigned to one of the three training levels. After the training was complete, the time (in minutes) it takes each employee to complete the task is recorded. Descriptive statistics and ANOVA results are given below.
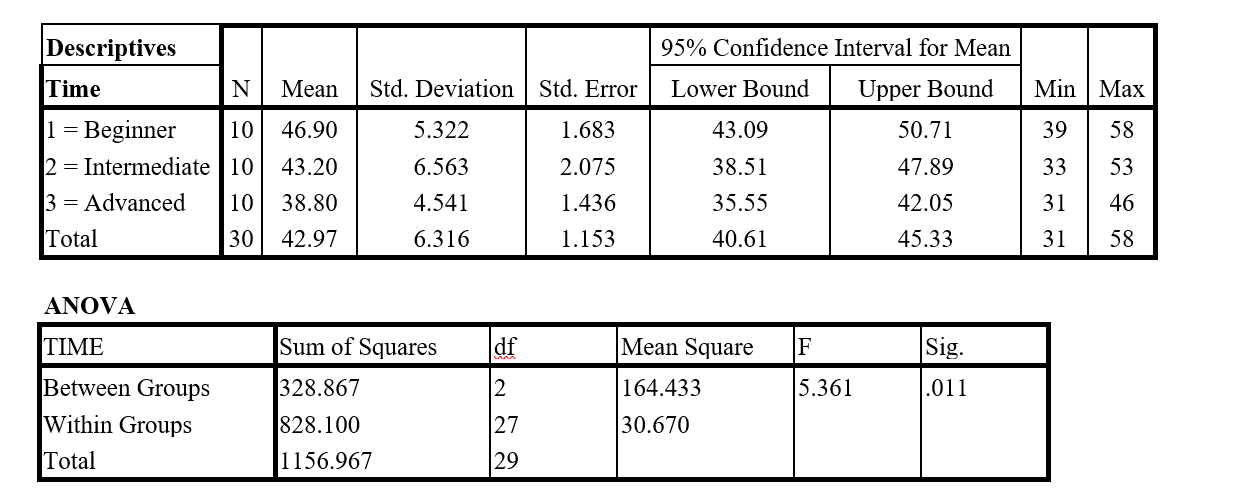 -Provide a 99% confidence interval for the population mean time it takes to complete the task for all employees that receive beginner level training.
Free
(Essay)
4.8/5 (30)
Correct Answer:Verified
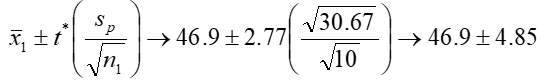 where the t* multiplier was found using N - k = 27 degrees of freedom. So the resulting confidence interval for the population mean time is (42.05, 51.75 ).
Use the following information for questions:
A study compared grade point averages (GPA) among students in 4 different majors (English, History, Statistics, and Art) using analysis of variance. A total sample size of 20 students (5 in each major) was studied.
-The p-value for the F-test is 0.013. If the significance level = 0.05, what is the conclusion from the analysis of variance?
(Multiple Choice)
4.8/5 (36)
Use the following information for questions:
Twenty students were randomly assigned to one of four exercise programs (5 students in each program), and the mean weight losses for the four programs were compared using one-way analysis of variance. The mean square error (MS Error) was 40. The mean weight loss for the first program was = 5 pounds.
-What is the standard error of , the sample mean weight loss in the first program?
(Multiple Choice)
4.8/5 (30)
Use the following information for questions:
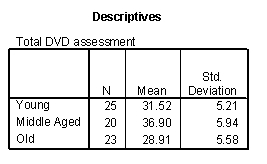
A researcher is hired by a company that sells appliances to investigate whether there is any difference in the average ratings that customers give to a DVD player between three different age groups. Sixty-eight people were asked to fill out a questionnaire and rate the DVD player by answering various questions (easy to use? looks nice? manual understandable?) after using it for a week. The scores (a value between 1 and 50) were recorded and a one-way ANOVA was performed. Partial SPSS output is provided below. 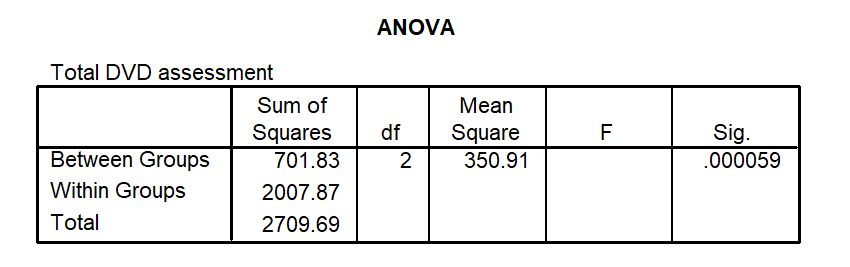 -Summary measures for the three groups are given below. Calculate a 95% confidence interval for the average DVD assessment score for the middle aged group.
(Essay)
4.7/5 (32)
At a certain college, the average difference in GPA for male sophomores compared to male freshmen is 0.5 point. The average difference in GPA for female freshmen compared to female freshmen is also 0.5 point. Based on this pattern, you can conclude
(Multiple Choice)
4.7/5 (49)
Use the following information for questions:
How old are babies when they learn how to crawl? Does it take longer in the winter months because of all the bulky clothes? Data was collected at various pediatricians' offices for six babies born in each of the months January, May and September. Parents indicated how old (in weeks) their baby was when they first started crawling (not scooting on the belly). The researcher has elected to conduct Mood's median test to analyze the results. Computer output is shown below:
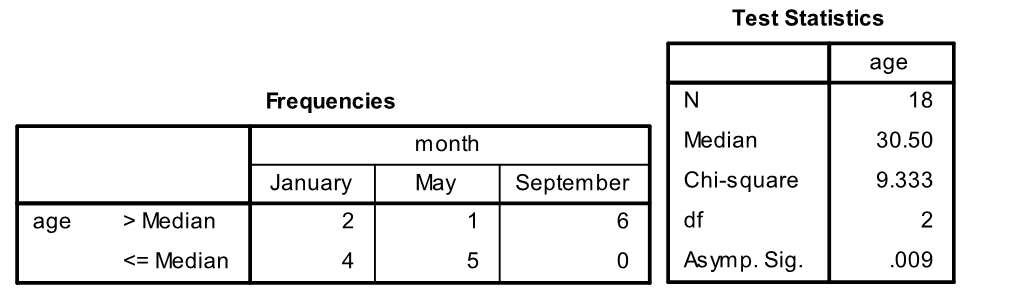 -What is the conclusion, using α = 0.01?
(Short Answer)
4.8/5 (40)
Use the following information for questions:
Using data from 496 respondents in a past General Social Survey, an analysis of variance is done to compare the mean ages in five populations defined by the highest educational degree received (no high school degree, high school degree, junior college, bachelor degree, graduate degree). Some Minitab output is shown below. 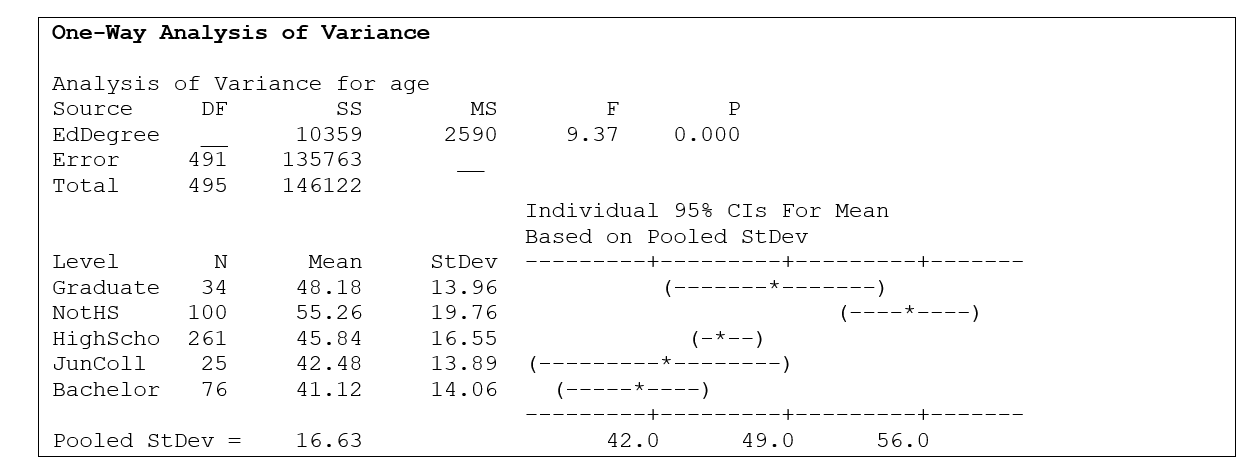 -What is the p-value?
(Short Answer)
4.9/5 (32)
Use the following information for questions:
A random sample of 235 students from University X is given a questionnaire about feelings. One of the questions was: "How do you feel about your height?" The answer categories were: too short, just about right, or too tall. A total feelings score is also calculated to measure the students' self worth. The results of theself worth score will be compared between the three groups defined by their feelings about their height andbetween boys and girl. The F-ratio for the interaction between feelings about height and gender is 4.98, with a p-value of 0.008.
-How many degrees of freedom are associated with the F-statistic for the interaction effect?
(Multiple Choice)
5.0/5 (28)
Use the following information for questions:
Eighty-one customers of a large-chain grocery store are asked to fill out an in-store survey. One of the questions on the survey asks about the use of coupons, while another question asks how much money the customer spent on groceries during that specific trip. The surveyor records the gender of the customer on the survey as well. A two-way ANOVA is used to compare the mean amounts spent in the store between the four groups defined by the type of coupons the customers used and between genders. The SPSS output is provided below. 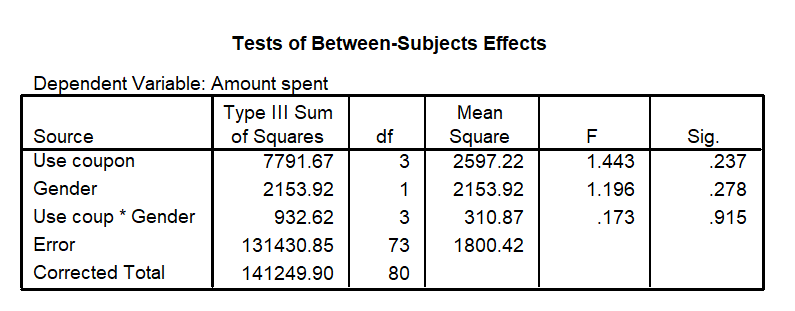 -According to the SPSS output the interaction between gender and using coupons ________ significant.
(Multiple Choice)
4.8/5 (40)
Use the following information for questions:
A supervisor wants to study the relationship between employee training and time required to complete a job-related task. Three levels of employee training are considered: Beginner, Intermediate, and Advanced. Thirty new employees were randomly selected and each employee was randomly assigned to one of the three training levels. After the training was complete, the time (in minutes) it takes each employee to complete the task is recorded. Descriptive statistics and ANOVA results are given below.
-The ANOVA table gives the F-statistic. What is the distribution of the F-statistic (if we assume that, on average, the time required to complete the task is the same across the three training level populations)?
(Essay)
4.8/5 (41)
Ninety people with high cholesterol are randomly divided into three groups of thirty, and a different treatment program for decreasing cholesterol is assigned to each group. The response variable is the change in cholesterol level after two months of treatment. An analysis of variance will be used to compare the three treatments. What null hypothesis is tested by this F-test?
(Multiple Choice)
4.7/5 (28)
Use the following information for questions:
A study compared weight loss among 5 different diet programs. A total sample size of 25 people was studied (5 people from each program) using one-way analysis of variance.
-The p-value of the F-test is 0.327. If the significance level = 0.05, what is the conclusion from the analysis of variance?
(Multiple Choice)
4.9/5 (43)
Use the following information for questions:
A student wanted to test whether there was a difference in the mean daily hours of study for students living in four different dormitories. She selected a random sample of 50 students from each of the four dormitories.
-What is the null hypothesis for this situation?
(Multiple Choice)
4.8/5 (31)
For a survey of 900 college students, the following table gives the average number of classes missed per week classified by gender and whether or not students are in a Greek organization (sorority/ fraternity).
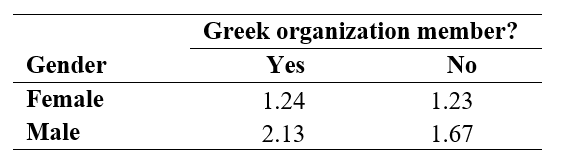 Based on the means given in the table, it appears that gender and Greek organization membership are
(Multiple Choice)
4.9/5 (29)
Use the following information for questions:
On a survey conducted at a university, students were asked how they felt about their weight (about right, overweight, or underweight), and also were asked to record their grade point average (GPA). There were 234 responses, with 160 saying their weight was about right, 50 said they were overweight, and 17 underweight. The question of interest is whether mean GPA is the same or differs for different weight attitude populations. Minitab output for the study is given below.
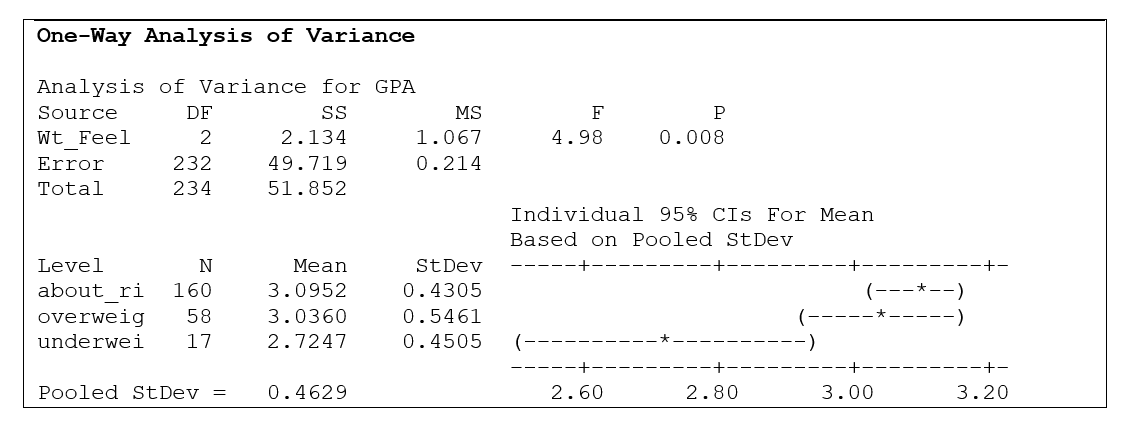 -If , and are the population means of GPA for the about right, overweight and underweight groups, respectively, then the alternative hypotheses tested by this analysis is:
(Multiple Choice)
4.8/5 (41)
A two-way analysis of variance is used to analyze the relationship between
(Multiple Choice)
4.8/5 (39)
Use the following information for questions:
Using data from 496 respondents in a past General Social Survey, a Kruskal-Wallis test is done to compare the median ages in five populations defined by the highest educational degree received (no high school degree, high school degree, junior college, bachelor degree, graduate degree). The Minitab output is provided below. 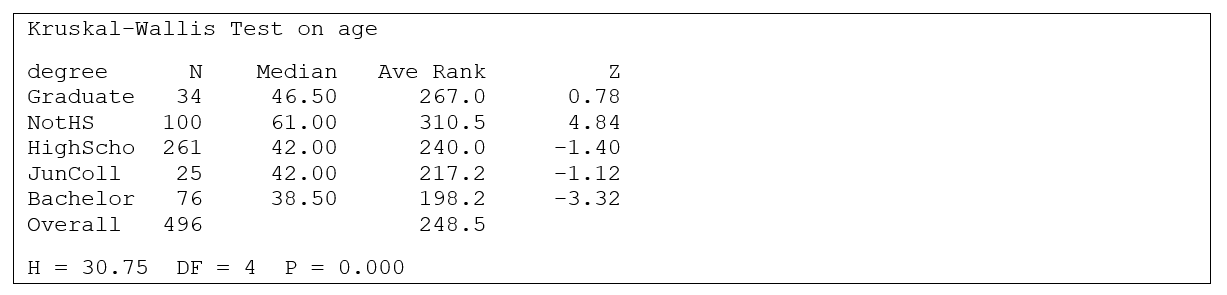 -What is the p-value?
(Short Answer)
5.0/5 (34)
Use the following information for questions:
On a survey conducted at a university, students were asked how they felt about their weight (about right, overweight, or underweight), and also were asked to record their grade point average (GPA). There were 234 responses, with 160 saying their weight was about right, 50 said they were overweight, and 17 underweight. The question of interest is whether mean GPA is the same or differs for different weight attitude populations. Minitab output for the study is given below.
-Assuming the population standard deviations are equal, the best estimate of the standard deviation of GPAs for the populations represented is:
(Multiple Choice)
4.8/5 (31)
Filters
- Essay(0)
- Multiple Choice(0)
- Short Answer(0)
- True False(0)
- Matching(0)