Exam 2: Turning Data Into Information
Exam 1: Statistics Success Stories and Cautionary Tales79 Questions
Exam 2: Turning Data Into Information94 Questions
Exam 3: Relationships Between Quantitative Variables99 Questions
Exam 4: Relationships Between Categorical Variables100 Questions
Exam 5: Sampling: Surveys and How to Ask Questions109 Questions
Exam 6: Gathering Useful Data for Examining Relationships90 Questions
Exam 7: Probability112 Questions
Exam 8: Random Variables115 Questions
Exam 9: Understanding Sampling Distributions: Statistics As Random Variables231 Questions
Exam 10: Estimating Proportions With Confidence104 Questions
Exam 11: Estimating Means With Confidence103 Questions
Exam 12: Testing Hypotheses About Proportions139 Questions
Exam 13: Testing Hypotheses About Means166 Questions
Exam 14: Inference About Simple Regression115 Questions
Exam 15: More About Inference for Categorical Variables111 Questions
Exam 16: Analysis of Variance111 Questions
Exam 17: Turning Information Into Wisdom70 Questions
Select questions type
Use the following information for questions:
Listed below is a stem-and-leaf plot of the times it took 13 students to drink a 12 ounce beverage. Values for stems represent seconds and values for leaves represent tenths of a second.
3| 1234
3| 5
4| 0
5| 6
6| 11379
7|
8| 2
-The upper quartile is
Free
(Multiple Choice)
4.8/5  (44)
(44)
Correct Answer: Verified
B
Use the following information for questions:
The following histogram gives the distribution of the difference between the actual and ideal weights for a sample of male college students. Ideal weights are responses to the question "What is your ideal weight"? The difference = actual -ideal. 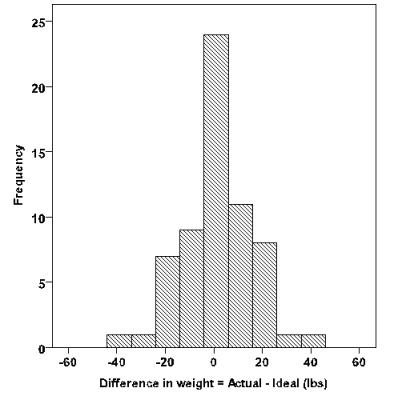 -What is the approximate shape of the distribution?
Free
(Multiple Choice)
4.7/5 (38)
Correct Answer:Verified
A
For a large sample of blood pressure values, the mean is 120 and the standard deviation is 10. Assuming a bell-shaped curve, which interval is likely to be about the interval from the minimum to maximum blood pressures in the sample?
Free
(Multiple Choice)
4.8/5 (40)
Correct Answer:Verified
C
For each of the following numerical summaries, decide whether it is a resistant statistic or not: mean, median, standard deviation, range, interquartile range.
(Short Answer)
4.8/5 (31)
Use the following information for questions:
The following histogram is for the weights (lbs) of 63 male college students.(Source: idealwtmen dataset on the CD.) 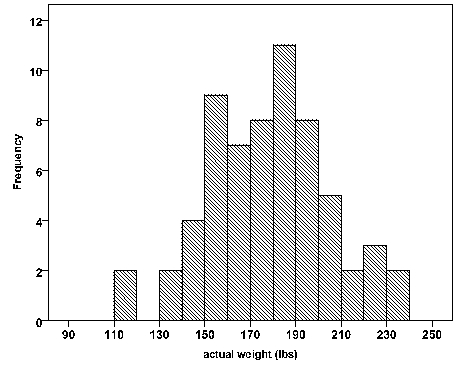 -The median weight for the 63 men is approximately
(Multiple Choice)
4.7/5 (35)
Use the following information for questions:
The average rainfall during the month of November in San Francisco, California, is 2.62 inches. The standard deviation is 2.79 inches.
-What is the standardized score (z-score) for 5.18 inches, the rainfall in San Francisco during November 2001?
(Short Answer)
4.8/5 (33)
Which of the following is not a term used for a quantitative variable?
(Multiple Choice)
4.8/5 (37)
Use the following information for questions:
Listed below is a stem-and-leaf plot of the times it took 13 students to drink a 12 ounce beverage. Values for stems represent seconds and values for leaves represent tenths of a second.
3| 1234
3| 5
4| 0
5| 6
6| 11379
7|
8| 2
-What was the median time to drink the beverage?
(Multiple Choice)
4.8/5 (42)
Use the following information for questions:
The following histogram gives the distribution of the difference between the actual and ideal weights for a sample of male college students. Ideal weights are responses to the question "What is your ideal weight"? The difference = actual -ideal.
-The median of the distribution is approximately
(Multiple Choice)
4.9/5 (40)
Use the following information for questions:
The following boxplot gives the distribution of the ratings of a new brand of peanut butter for 50 randomly selected consumers (100 points possible with higher points corresponding to a more favorable rating). 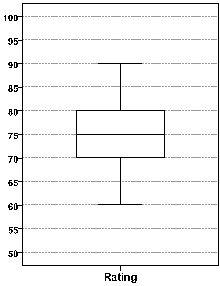 -The upper quartile is between
(Multiple Choice)
4.9/5 (28)
Use the following information for questions:
In a survey of 1000 adults, respondents were asked about the expense of a college education and the relative necessity of financial assistance. The correspondents were classified as to whether they currently had a child in college or not (college status), and whether they thought the loan obligation for most college students was too high, about right, or too little (loan obligation opinion). The table below summarizes some of the survey results. Use these results to answer the following questions. 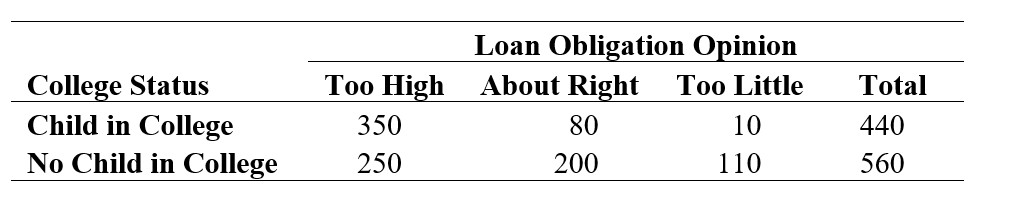 -What role does the variable Loan Obligation Opinion play in this study?
(Multiple Choice)
4.7/5 (35)
Tallies and cross-tabulations are used to summarize which of these variable types?
(Multiple Choice)
4.8/5 (37)
A list of 5 pulse rates is: 70, 64, 80, 74, 92. What is the median for this list?
(Multiple Choice)
4.8/5 (30)
Use the following information for questions:
According to a national sleep foundation survey, around 31 million Americans are sleep deprived. They also say women need more sleep than men and are being short-changed. Below are the five number summaries for the number of hours of sleep at night based on a survey of American men and women.
Men: 5.5, 6, 6.5, 7.5, 9
Women: 4.5, 5, 6, 7, 8
-Write a sentence to compare men versus women in terms of the interquartile range for the amount of sleep at night.
(Short Answer)
4.9/5 (35)
Which of the following measures is not a measure of spread?
(Multiple Choice)
4.8/5 (40)
Use the following information for questions:
The table below provides a statistical summary of the number of CDs owned as reported by students in a class survey done at Penn State University.
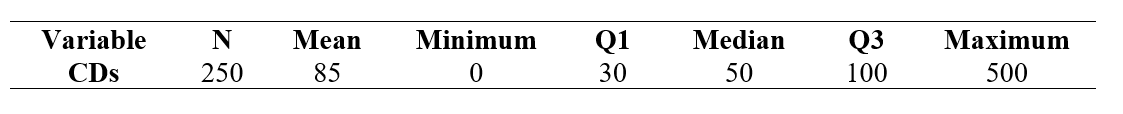 -Based on the summary shown, which of the following statements most likely describes the shape of the CDs owned dataset?
(Multiple Choice)
4.9/5 (39)
Use the following information for questions:
In a survey, students are asked how many hours they study in a typical week. A five-number summary of the responses is: 2, 9, 14, 20, 60.
-Which interval describes the number of hours spent studying in a typical week for about 50% of the students sampled?
(Multiple Choice)
4.9/5 (33)
Use the following information for questions:
A psychologist has developed a new technique intended to improve rote memory. To test the method against other standard methods, 45 high school students are selected at random and each is taught the new technique. The data on the number of words memorized correctly by the students were used to create the following histogram. Note the first class represents the interval [70, 72). 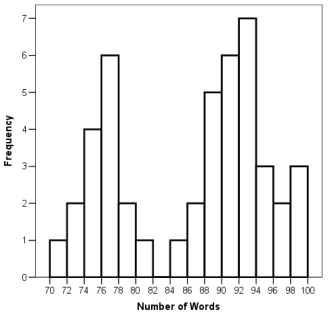 -Can we calculate the exact range of the 45 responses? If yes, calculate it. If no, explain why not.
(Essay)
4.8/5 (29)
The following boxplot is for the results of the women's 400-meter dash final race during the 2000 Olympics in Sydney, Australia. Cathy Freeman won in 49.11 seconds. Choose the correct statement about the boxplot. 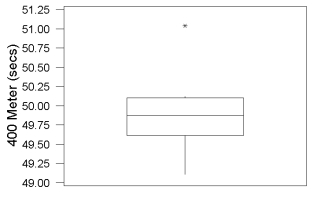
(Multiple Choice)
4.8/5 (32)
Filters
- Essay(0)
- Multiple Choice(0)
- Short Answer(0)
- True False(0)
- Matching(0)