Exam 12: Testing Hypotheses About Proportions
Exam 1: Statistics Success Stories and Cautionary Tales79 Questions
Exam 2: Turning Data Into Information94 Questions
Exam 3: Relationships Between Quantitative Variables99 Questions
Exam 4: Relationships Between Categorical Variables100 Questions
Exam 5: Sampling: Surveys and How to Ask Questions109 Questions
Exam 6: Gathering Useful Data for Examining Relationships90 Questions
Exam 7: Probability112 Questions
Exam 8: Random Variables115 Questions
Exam 9: Understanding Sampling Distributions: Statistics As Random Variables231 Questions
Exam 10: Estimating Proportions With Confidence104 Questions
Exam 11: Estimating Means With Confidence103 Questions
Exam 12: Testing Hypotheses About Proportions139 Questions
Exam 13: Testing Hypotheses About Means166 Questions
Exam 14: Inference About Simple Regression115 Questions
Exam 15: More About Inference for Categorical Variables111 Questions
Exam 16: Analysis of Variance111 Questions
Exam 17: Turning Information Into Wisdom70 Questions
Select questions type
Use the following information for questions:
A study was conducted to learn about drinking and driving habits of male and female college students. Independent random samples of 942 female students and 754 male students were obtained. Of those sampled, 181 female and 181 male students admitted that they had driven after consuming an alcoholic beverage. Is this sufficient evidence to conclude that male college students tend to drive after drinking more frequently than female college students? Let 1 = females and 2 = males, so that the appropriate hypotheses to be tested are:H0: p1 = p2 versus Ha: p1 < p2. Set the significance level to 0.01.
-The z-statistic for testing the hypotheses is z = -2.4. What is the corresponding p-value?
Free
(Multiple Choice)
4.8/5  (35)
(35)
Correct Answer: Verified
C
Use the following information for questions:
A study was conducted to learn about drinking and driving habits of male and female college students. Independent random samples of 942 female students and 754 male students were obtained. Of those sampled, 181 female and 181 male students admitted that they had driven after consuming an alcoholic beverage. Is this sufficient evidence to conclude that male college students tend to drive after drinking more frequently than female college students? Let 1 = females and 2 = males, so that the appropriate hypotheses to be tested are:H0: p1 = p2 versus Ha: p1 < p2. Set the significance level to 0.01.
-Based on this study, we can conclude that smoking ________ more popular among men.
Free
(Multiple Choice)
4.8/5 (33)
Correct Answer:Verified
C
Use the following information for questions:
A sample of n = 200 college students is asked if they believe in extraterrestrial life and 120 of these students say that they do. The data are used to test H0: p = 0.5 versus Ha: p > 0.5, where p is the population proportion of college students who say they believe in extraterrestrial life. The following Minitab output was obtained:  -Based on the decision made in question 70, what mistake could have been made?
Free
(Multiple Choice)
4.8/5 (34)
Correct Answer:Verified
A
Use the following information for questions:
The null and alternative hypotheses for p = proportion of students who buy at least 3 textbooks in a semester is given below:
H0: p = 0.80 (or p ≤ 0.80)
Ha: p > 0.80
The results of a study gave a p-value of 0.08. The results of this study also stated that the study results were not statistically significant.
-What mistake could the researchers have made?
(Short Answer)
4.9/5 (34)
If the result of a hypothesis test for a proportion is statistically significant, then
(Multiple Choice)
4.7/5 (39)
Use the following information for questions:
A researcher examined the folklore that women can predict the sex of their unborn child better than chance would suggest. She asked 104 pregnant women to predict the sex of their unborn child, and 57 guessed correctly. Using these data, the researcher created the following Minitab output.  -Which choice describes how the p-value was computed in this situation?
(Multiple Choice)
4.9/5 (29)
The designated level (typically set at 0.05) to which the p-value is compared to, in order to decide whether the alternative hypothesis is accepted or not is called a
(Multiple Choice)
4.8/5 (33)
Use the following information for questions:
An airport official wants to prove that the p1 = proportion of delayed flights after a storm for Airline 1 was different from p2 = the proportion of delayed flights for Airline 2. Random samples from the two airlines after a storm showed that 50 out of 100 of Airline 1's flights were delayed, and 70 out of 200 of Airline 2's flights were delayed.
-Report your conclusion in terms of the two airlines.
(Multiple Choice)
5.0/5 (36)
Use the following information for questions:
A random sample of 850 high school girls showed that 400 had done strenuous exercise over the past year. The researcher wants to test the hypotheses below for p = the proportion of all high school girls who do strenuous exercise.
H0: p ≥ 0.50
Ha: p < 0.50
-State the null hypothesis (H0) and the alternative hypothesis (Ha) in words.
(Short Answer)
4.8/5 (37)
Use the following information for questions:
A random sample of 850 high school girls showed that 400 had done strenuous exercise over the past year. The researcher wants to test the hypotheses below for p = the proportion of all high school girls who do strenuous exercise.
H0: p ≥ 0.50
Ha: p < 0.50
-Verify necessary data conditions for a z-statistic and calculate the z-statistic.
(Short Answer)
4.8/5 (34)
Use the following information for questions:
A hypothesis test for a population proportion p is given below:
H0: p ≤ 0.40
Ha: p > 0.40
For each z-statistic, calculate the p-value for the hypothesis test.
-z-statistic =-1.50. p-value = ?
(Multiple Choice)
4.9/5 (26)
Use the following information for questions:
Data were collected by giving a survey to a random sample of students at a university. One question asked was: "Do you believe in extraterrestrial life?"Here is a comparison of the proportions of males and females that said "yes":
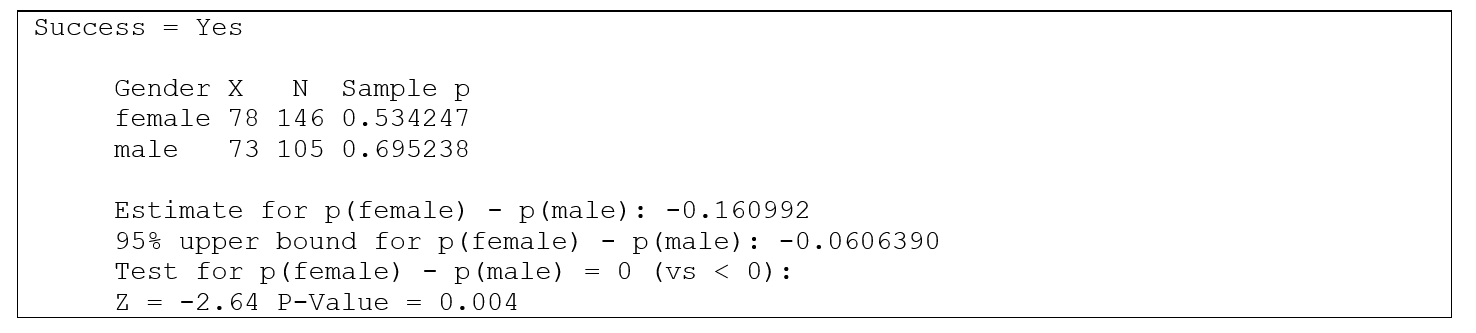 Subscripts in these questions are 1 = females, 2 = males.
-How is the p-value for this test found?
Subscripts in these questions are 1 = females, 2 = males.
-How is the p-value for this test found?
(Multiple Choice)
4.8/5 (35)
Use the following information for questions:
A random sample of 600 high school boys showed that 40 had taken diet pills during the past 30 days to lose weight The researcher wants to test the hypotheses below for p = the proportion of all high school boys who take diet pills to lose weight.
H0: p =0.10
Ha: p ≠ 0.10
-State the null hypothesis (H0) and the alternative hypothesis (Ha) in words.
(Short Answer)
4.7/5 (35)
Use the following information for questions:
A random sample of 850 high school girls showed that 400 had done strenuous exercise over the past year. The researcher wants to test the hypotheses below for p = the proportion of all high school girls who do strenuous exercise.
H0: p ≥ 0.50
Ha: p < 0.50
-Report the conclusion in the context of the situation.
(Short Answer)
4.7/5 (32)
Use the following information for questions:
An airport official wants to prove that the p1 = proportion of delayed flights after a storm for Airline A is less than p2 = the proportion of delayed flights for Airline B. Random samples from two airlines after a storm showed that 51 out of 200 of Airline A's flights were delayed, and 60 out of 200 of Airline B's flights were delayed.
-What is the value of the test statistic?
(Multiple Choice)
4.9/5 (34)
A Washington Post poll shows that concerns about housing payments have spiked despite some improvements in the overall economy. In all, 53 percent of the 900 American adults surveyed said they are "very concerned"or "somewhat concerned"about having the money to make their monthly payment. Let p represent the population proportion of all American adults who are "very concerned"or "somewhat concerned"about having the money to make their monthly payment. Which are the appropriate hypotheses to assess if a majority of American adults are worried about making their mortgage or rent payments?
(Multiple Choice)
4.9/5 (30)
Use the following information for questions:
Time magazine recently polled 500 13-year-olds online to get a glimpse into their world. The results may surprise many people: 13-year-olds in 2005 enjoy their relationships with their parents, are less likely to drink or do drugs than previous generations, and they are highly focused, competitive and determined to succeed. The overscheduled toddlers of the 1990s are now controlling their own schedules, and in many cases, their days are just as jam-packed as ever. It seems today's teens are not only used to being extremely busy, they thrive on it. One result from the Time Poll was that 53 percent of the 13-year-olds polled said their parents are very involved in their lives. Suppose that 200 of the 13-year olds were boys and 300 of them were girls. We wish to find out if the proportion of 13-year old boys and girls who say that their parents are very involved in their lives are the same. Let the boys be represented by subscript 1 and girls by 2.
-Is the probability that we have made a Type 2 error equal to 1 - 0.01 = 0.99 or 99%?
(True/False)
4.9/5 (38)
Use the following information for questions:
Suppose that two different studies were conducted to determine whether the proportion of overweight men is 30% (null hypothesis) or different from 30% (alternative hypothesis). One study enrolled 100 men, while the other study enrolled 1000 men. Both studies resulted in the same sample proportion of overweight men, 35%. However, the p-values were very different: one study gave a p-value = 0.275 while the other study gave a p-value = 0.0006.
-Decide which study produced each p-value.
(Short Answer)
4.9/5 (37)
Use the following information for questions:
A hypothesis test for a population proportion p is given below:
H0: p = 0.10
Ha: p ≠ 0.10
For each sample size n and sample proportion compute the value of the z-statistic.
-Sample size n = 100 and sample proportion = 0.15. z-statistic = ?
(Multiple Choice)
5.0/5 (31)
Filters
- Essay(0)
- Multiple Choice(0)
- Short Answer(0)
- True False(0)
- Matching(0)