Exam 16: Regression
Exam 1: Introduction37 Questions
Exam 2: Summarizing Data: Listing and Grouping63 Questions
Exam 3: Summarizing Data: Measures of Location57 Questions
Exam 4: Summarizing Data: Measures of Variation56 Questions
Exam 5: Possibilities and Probabilities63 Questions
Exam 6: Some Rules of Probability75 Questions
Exam 7: Expectations and Decisions49 Questions
Exam 8: Probability Distributions78 Questions
Exam 9: The Normal Distribution89 Questions
Exam 10: Sampling and Sampling Distributions61 Questions
Exam 11: Problems of Estimation13 Questions
Exam 12: Tests of Hypotheses: Means55 Questions
Exam 13: Tests of Hypotheses: Standard Deviations39 Questions
Exam 14: Tests of Hypotheses Based on Count Data43 Questions
Exam 15: Analysis of Variance49 Questions
Exam 16: Regression39 Questions
Exam 17: Correlation28 Questions
Exam 18: Nonparametric Tests41 Questions
Select questions type
The symbol in the least-squares equation is a sample estimate of
(Multiple Choice)
4.9/5  (36)
(36)
The symbol in the least-squares equation is a sample estimate of
(Multiple Choice)
4.9/5 (44)
In a test of the null hypothesis that against the alternative hypothesis that , the null hypothesis will be rejected if the obtained value is __________ the tabled value.
(Short Answer)
4.7/5 (41)
The symbols used for the estimated regression coefficients when there is one independent variable are __________ and __________
(Short Answer)
4.7/5 (36)
In regression analysis, the variable that we are trying to predict is called the independent variable.
(True/False)
4.9/5 (36)
A confidence interval for a future individual value is wider than a confidence interval for a mean of when .
(True/False)
4.9/5 (46)
Table 16.2
The data gives the number of year olds (for the given years) whose families earn between per year and the number of U.S. college students for the given year ( ).
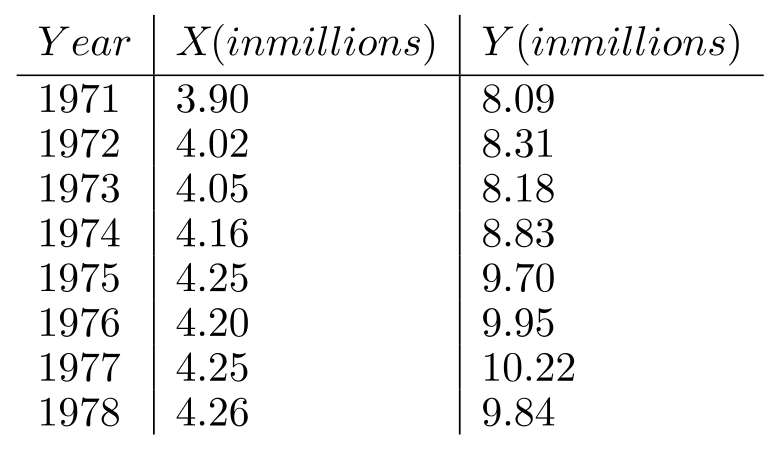 -Use the data in Table 16.2 to:
a. Find the least-squares regression equation which predicts from .
b. Find the standard error of estimate.
c. Predict if .
-Use the data in Table 16.2 to:
a. Find the least-squares regression equation which predicts from .
b. Find the standard error of estimate.
c. Predict if .
(Short Answer)
4.9/5 (35)
Table 16.1
The table below shows annual profit figures (in thousands of dollars) for a company.
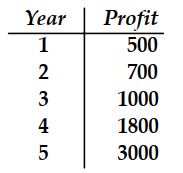 -Fit a power curve to the data in Table 16.1.
(Short Answer)
4.8/5 (48)
If paired data plotted on semi-log paper fall close to a straight line, then we would expect a (an) __________.
(Short Answer)
4.8/5 (38)
The advertising expense and profit of a company in thousands of dollars for each of five years is given below:
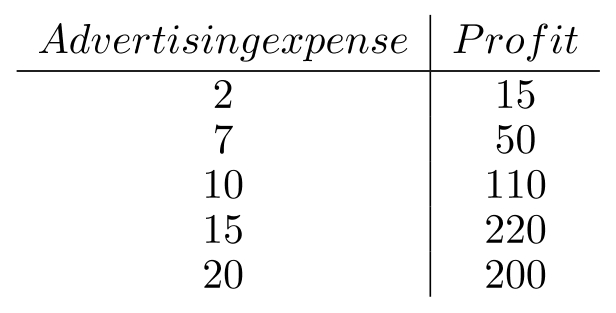 a. Solve the normal equations to find the equation of the least-squares line which will allow us to predict profit from advertising expense.
b. Check your values of and using the "solutions of normal equation."
c. If advertising expense is to be for a particular year, predict the profit for that year.
a. Solve the normal equations to find the equation of the least-squares line which will allow us to predict profit from advertising expense.
b. Check your values of and using the "solutions of normal equation."
c. If advertising expense is to be for a particular year, predict the profit for that year.
(Short Answer)
4.8/5 (35)
The width of a confidence interval for will be increased if
(Multiple Choice)
4.9/5 (41)
The standard deviation measures the dispersion of the values about the estimated least-squares line.
(True/False)
5.0/5 (31)
When we use observed data to derive a mathematical equation and use it to predict the value of one variable from a given value of another, the procedure is known as __________.
(Short Answer)
4.9/5 (44)
If the slope of the true regression line is zero, then the slope of the sample regression line may be different from zero.
(True/False)
4.9/5 (39)
Filters
- Essay(0)
- Multiple Choice(0)
- Short Answer(0)
- True False(0)
- Matching(0)