Exam 4: Hypothesis Tests
Exam 1: Collecting Data68 Questions
Exam 2: Describing Data125 Questions
Exam 3: Confidence Intervals148 Questions
Exam 4: Hypothesis Tests119 Questions
Exam 5: Approximating With a Distribution74 Questions
Exam 6: Inference for Means and Proportions166 Questions
Exam 7: Chi-Square Tests for Categorical Variables47 Questions
Exam 8: Anova to Compare Means52 Questions
Exam 9: Inference for Regression123 Questions
Exam 10: Multiple Regression72 Questions
Exam 11: Probability Basics165 Questions
Select questions type
Use the following
The owner of a small pet supply store wants to open a second store in another city, but he only wants to do so if more than one-third of the city's households have pets (otherwise there won't be enough business). He samples 150 of the households and finds that 64 have pets.
-Describe how you would generate a single randomization sample in this situation, and identify (using the appropriate notation) the sample statistic you would record for each sample.
(Essay)
4.9/5  (33)
(33)
Use the following
A student in an introductory statistics course investigated if there is evidence that the proportion of milk chocolate M&M's that are green differs from the proportion of dark chocolate M&M's that are green. She purchased a bag of each variety, and her data are summarized in the following table.
 -Define the appropriate parameter(s) and state the hypotheses for testing if the proportion of green M&M's differs for milk chocolate and dark chocolate M&M's.
(Essay)
4.7/5 (43)
Use the following
As of August 8, 2012, the national average price for a gallon of regular unleaded gasoline was $3.63. The prices for a sample of n = 10 gas stations in the state of Illinois are provided.
 It is of interest to use this sample to compare the average gas price in Illinois to the national average.
-Describe how you would generate a single randomization sample in this situation, and identify (using the appropriate notation) the sample statistic you would record for each sample.
It is of interest to use this sample to compare the average gas price in Illinois to the national average.
-Describe how you would generate a single randomization sample in this situation, and identify (using the appropriate notation) the sample statistic you would record for each sample.
(Essay)
4.7/5 (32)
It is believed that about 37% of college students binge drink (5 or more drinks for men, and 4 or more drinks for women, in two hours). Administrators at a small university of 6,000 students want to do a study to determine if the proportion of their students who binge drink differs from 37%. They select a sample of 98 students enrolled at the university to survey about their drinking behavior. When generating the randomization distribution for this test, how large should each individual randomization sample be?
(Multiple Choice)
4.9/5 (30)
Use the following
A Division III college men's basketball team is interested in identifying factors that impact the outcomes of their games. They plan to use "point spread"
(their score minus their opponent's score) to quantify the outcome of each game this season; positive values indicate games that they won while negative values indicate games they lost. They want to determine if "steal differential"
(the number of steals they have in the game minus the number of steals their opponent had) is related to point spread; positive values indicate games where they had more steals than their opponent. The data for the n = 25 games they played this season displayed in the provided table.
 Assuming that this season was a typical season for the team, they want to know if steal differential is positively correlated with point spread.
-Describe how you would generate a single randomization sample in this situation, and identify (using the appropriate notation) the sample statistic you would record for each sample.
Assuming that this season was a typical season for the team, they want to know if steal differential is positively correlated with point spread.
-Describe how you would generate a single randomization sample in this situation, and identify (using the appropriate notation) the sample statistic you would record for each sample.
(Essay)
4.9/5 (35)
Use the following
In May 2012, President Obama made history by revealing his support of gay marriage. Around that time, the Gallup Organization polled 1,024 U.S. adults about their opinions on gay/lesbian relations and gay marriage. They found that 54% of those sampled viewed gay/lesbian relations as "morally acceptable" and that 50% felt that gay marriage should be legal.
-Does this sample provide evidence that the majority of Americans find gay/lesbian relations "morally acceptable"? Describe how you could generate a single randomization sample in this situation, and identify the statistic that you would calculate for each sample.
(Essay)
4.8/5 (29)
Use the following
A student in an introductory statistics course investigated if there is evidence that the proportion of milk chocolate M&M's that are green differs from the proportion of dark chocolate M&M's that are green. She purchased a bag of each variety, and her data are summarized in the following table.
-Describe how you would generate a single randomization sample in this situation, and identify (using the appropriate notation) the sample statistic you would record for each sample.
(Essay)
4.9/5 (38)
Use the following
A Division III college men's basketball team is interested in identifying factors that impact the outcomes of their games. They plan to use "point spread"
(their score minus their opponent's score) to quantify the outcome of each game this season; positive values indicate games that they won while negative values indicate games they lost. They want to determine if "steal differential"
(the number of steals they have in the game minus the number of steals their opponent had) is related to point spread; positive values indicate games where they had more steals than their opponent. The data for the n = 25 games they played this season displayed in the provided table.
Assuming that this season was a typical season for the team, they want to know if steal differential is positively correlated with point spread.
-Define the appropriate parameter(s) and state the hypotheses for testing if this sample provides evidence that steal differential is positively correlated with point spread.
(Essay)
5.0/5 (46)
Use the following
Match each p-value to the most appropriate conclusion.
-________ "The result is significant at the 5% level but not at a 1% level."
(Multiple Choice)
4.8/5 (39)
Use the following
A student in an introductory statistics course investigated if there is evidence that the proportion of milk chocolate M&M's that are green differs from the proportion of dark chocolate M&M's that are green. She purchased a bag of each variety, and her data are summarized in the following table.
 -Use the provided randomization distribution (based on 100 samples) to estimate the p-value for this sample.
(Essay)
4.9/5 (32)
Use the following
There are 24 students enrolled in an introductory statistics class at a small university. As an in-class exercise the students were asked how many hours of television they watch each week. Their responses, broken down by gender, are summarized in the provided table. Assume that the students enrolled in the statistics class are representative of all students at the university.
 -Does this sample provide evidence that, on average, male students watch more television than female students at this university? Describe how you could generate a single randomization sample in this situation, and identify the statistic that you would calculate for each sample.
(Essay)
4.9/5 (38)
Use the following
A student in an introductory statistics course investigated if there is evidence that the proportion of milk chocolate M&M's that are green differs from the proportion of dark chocolate M&M's that are green. She purchased a bag of each variety, and her data are summarized in the following table.
-Use your p-value to make a decision about these hypotheses. Be sure to word your decision in the context of the problem. Include an assessment of the strength of your evidence.
(Essay)
4.8/5 (40)
Use the following
Match each p-value to the most appropriate conclusion.
-________ "The evidence against the null and in favor of the alternative is very strong.
(Multiple Choice)
4.9/5 (34)
Using the definition of a p-value, explain why the area in the tail of a randomization distribution is used to compute a p-value.
(Essay)
4.9/5 (41)
Use the following
A certain species of tree has an average life span of 130 years. A researcher has noticed a large number of trees of this species washing up along a beach as driftwood. She takes core samples from 27 of those trees to count the number of rings and measure the widths of the rings. Counting the rings allows the researcher to determine the age of each tree. The average age of the trees in the sample is approximately 120 years. One of her interests is determining if this sample provides evidence that the average age of the driftwood is less than the 130 year life span expected for this type of tree. If the average age is less than 130 years it might suggest that the trees have died from unusual causes, such as invasive beetles or logging.
-Describe how you would generate a single randomization sample in this situation, and identify the statistic you would calculate for each sample.
(Essay)
4.7/5 (32)
Use the following
There are 24 students enrolled in an introductory statistics class at a small university. As an in-class exercise the students were asked how many hours of television they watch each week. Their responses, broken down by gender, are summarized in the provided table. Assume that the students enrolled in the statistics class are representative of all students at the university.
 -Describe how you would generate a single randomization sample in this situation, and identify (using the appropriate notation) the sample statistic you would record for each sample.
(Essay)
4.8/5 (34)
Use the following
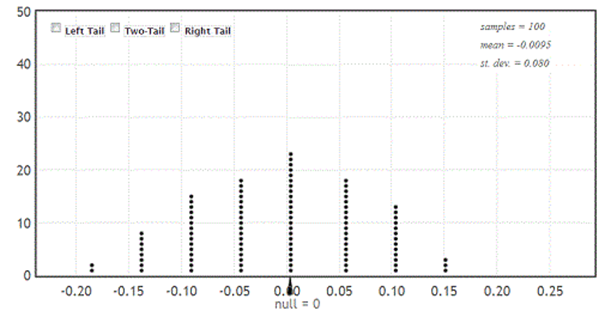
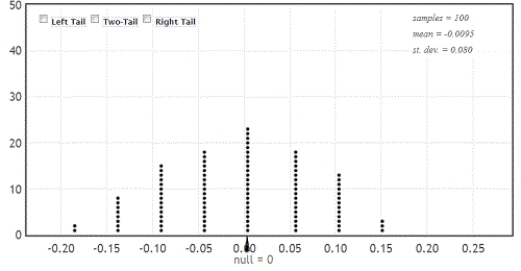
The owner of a small pet supply store wants to open a second store in another city, but he only wants to do so if more than one-third of the city's households have pets (otherwise there won't be enough business). He samples 150 of the households and finds that 64 have pets.
-Use the provided randomization distribution (based on 100 samples) to estimate the p-value for this sample.

(Essay)
4.9/5 (38)
Use the following
A student in an introductory statistics course investigated if there is evidence that the proportion of milk chocolate M&M's that are green differs from the proportion of dark chocolate M&M's that are green. She purchased a bag of each variety, and her data are summarized in the following table.
 -Use the provided randomization distribution (based on 100 samples) to test if this sample provides evidence that the proportion of candies that are green differs for the two types of M&M's. Include an assessment of the strength of your evidence.
(Essay)
4.8/5 (29)
Use the following
A study recently described in Attention, Perception, and Psychophysics investigated the impacts of mult-tasking on people who play video games and those who don't. Participants in the study were asked to perform three visually demanding tasks with (dual-task) and without (single-task) answering unrelated questions over the phone. One of the tasks involved tracking multiple circles moving around on a computer monitor. At the 5% significance level, the authors of the study concluded "tracking accuracy was significantly worse in the dual-task condition"
for both people who play video games and those who do not.
-What conclusion would the authors have made at the 1% significance level?
(Multiple Choice)
4.8/5 (40)
Filters
- Essay(0)
- Multiple Choice(0)
- Short Answer(0)
- True False(0)
- Matching(0)