Exam 4: Hypothesis Tests
Exam 1: Collecting Data68 Questions
Exam 2: Describing Data125 Questions
Exam 3: Confidence Intervals148 Questions
Exam 4: Hypothesis Tests119 Questions
Exam 5: Approximating With a Distribution74 Questions
Exam 6: Inference for Means and Proportions166 Questions
Exam 7: Chi-Square Tests for Categorical Variables47 Questions
Exam 8: Anova to Compare Means52 Questions
Exam 9: Inference for Regression123 Questions
Exam 10: Multiple Regression72 Questions
Exam 11: Probability Basics165 Questions
Select questions type
Use the following
As of August 8, 2012, the national average price for a gallon of regular unleaded gasoline was $3.63. The prices for a sample of n = 10 gas stations in the state of Illinois are provided.
 It is of interest to use this sample to compare the average gas price in Illinois to the national average.
-Use technology and the provided data to test if this sample provides evidence that the average gas price in Illinois exceeds the national average. Include an assessment of the strength of your evidence.
It is of interest to use this sample to compare the average gas price in Illinois to the national average.
-Use technology and the provided data to test if this sample provides evidence that the average gas price in Illinois exceeds the national average. Include an assessment of the strength of your evidence.
(Essay)
5.0/5  (37)
(37)
Use the following
The owner of a small pet supply store wants to open a second store in another city, but he only wants to do so if more than one-third of the city's households have pets (otherwise there won't be enough business). He samples 150 of the households and finds that 64 have pets.
-Define the appropriate parameter(s) and state the hypotheses for testing if this sample provides evidence that more than one-third of households in this city own pets.
(Essay)
4.8/5 (43)
The provided histogram displays the prices (in thousands of dollars) of 17 homes sold between November 2011 and February 2012 in a Midwestern city.
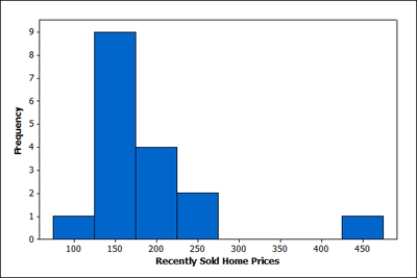 In general this shape, right skewed with some unusually high values, is common for describing home values in many cities. For this reason, the median home value for a city is a useful parameter. This sample of recently sold homes had a median price (value) of $166,500. Someone considering moving to this city is interested in knowing if the median home value is more than $150,000.
Describe how you would generate a single randomization sample in this situation, and identify the statistic you would calculate from the sample.
In general this shape, right skewed with some unusually high values, is common for describing home values in many cities. For this reason, the median home value for a city is a useful parameter. This sample of recently sold homes had a median price (value) of $166,500. Someone considering moving to this city is interested in knowing if the median home value is more than $150,000.
Describe how you would generate a single randomization sample in this situation, and identify the statistic you would calculate from the sample.
(Essay)
4.9/5 (34)
In August 2012 Gallup reported the results from a survey of 177,663 U.S. adults from January - June 2012 for the Gallup-Healthways Well-Being Index. Based on self-reported height and weight data, they found that 62.8% of U.S. adults are overweight or obese. A 95% confidence interval for the proportion of U.S. adults that are overweight or obese is (0.626, 0.63). Does this interval support the claim that "two-thirds of Americans are overweight or obese"? Briefly justify your answer.
(Essay)
4.8/5 (39)
Use the following
There are 24 students enrolled in an introductory statistics class at a small university. As an in-class exercise the students were asked how many hours of television they watch each week. Their responses, broken down by gender, are summarized in the provided table. Assume that the students enrolled in the statistics class are representative of all students at the university.
 -Use technology to determine if this sample provides evidence that, on average, male students watch more television than female students at this university. Include an assessment of the strength of the evidence.
(Essay)
4.8/5 (34)
Use the following
A certain species of tree has an average life span of 130 years. A researcher has noticed a large number of trees of this species washing up along a beach as driftwood. She takes core samples from 27 of those trees to count the number of rings and measure the widths of the rings. Counting the rings allows the researcher to determine the age of each tree. Her data are displayed in the provided table. One of her interests is determining if this sample provides evidence that the average age of the driftwood is less than the 130 year life span expected for this type of tree. If the average age is less than 130 years it might suggest that the trees have died from unusual causes, such as invasive beetles or logging.
 -Use your p-value and a 5% significance level to make a decision about these hypotheses. Be sure to word your decision in the context of the problem.
(Essay)
4.9/5 (41)
Use the following
A certain species of tree has an average life span of 130 years. A researcher has noticed a large number of trees of this species washing up along a beach as driftwood. She takes core samples from 27 of those trees to count the number of rings and measure the widths of the rings. Counting the rings allows the researcher to determine the age of each tree. The average age of the trees in the sample is about 120 years. One of her interests is determining if this sample provides evidence that the average age of the driftwood is less than the 130 year life span expected for this type of tree. If the average age is less than 130 years it might suggest that the trees have died from unusual causes, such as invasive beetles or logging.
-Describe how you would generate a single randomization sample in this situation, and identify the statistic you would calculate for each sample.
(Essay)
4.8/5 (41)
Use the following
There are 24 students enrolled in an introductory statistics class at a small university. As an in-class exercise the students were asked how many hours of television they watch each week. Their responses, broken down by gender, are summarized in the provided table. Assume that the students enrolled in the statistics class are representative of all students at the university.
 -Use your p-value to make a decision about these hypotheses. Be sure to word your decision in the context of the problem. Include an assessment of the strength of the evidence.
(Essay)
4.8/5 (44)
Use the following
A Division III college men's basketball team is interested in identifying factors that impact the outcomes of their games. They plan to use "point spread"
(their score minus their opponent's score) to quantify the outcome of each game this season; positive values indicate games that they won while negative values indicate games they lost. They want to determine if "steal differential"
(the number of steals they have in the game minus the number of steals their opponent had) is related to point spread; positive values indicate games where they had more steals than their opponent. The data for the n = 25 games they played this season displayed in the provided table.
 Assuming that this season was a typical season for the team, they want to know if steal differential is positively correlated with point spread.
-Use your p-value to make a decision about these hypotheses. Be sure to word your decision in the context of the problem.
Assuming that this season was a typical season for the team, they want to know if steal differential is positively correlated with point spread.
-Use your p-value to make a decision about these hypotheses. Be sure to word your decision in the context of the problem.
(Essay)
4.8/5 (29)
Use the following
Match each p-value to the most appropriate conclusion.
-________ "The evidence against the null is significant, but only at the 10% level."
(Multiple Choice)
4.8/5 (33)
Use the following
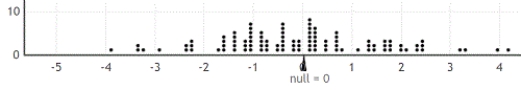
There are 24 students enrolled in an introductory statistics class at a small university. As an in-class exercise the students were asked how many hours of television they watch each week. Their responses, broken down by gender, are summarized in the provided table. Assume that the students enrolled in the statistics class are representative of all students at the university.
-Use the provided randomization distribution (based on 100 samples) to determine if this sample provides evidence that, on average, male students watch more television than female students at this university. Include an assessment of the strength of the evidence.
(Essay)
4.8/5 (26)
Use the following
As of August 8, 2012, the national average price for a gallon of regular unleaded gasoline was $3.63. The prices for a sample of n = 10 gas stations in the state of Illinois are provided.
It is of interest to use this sample to compare the average gas price in Illinois to the national average.
-Describe how you could generate a single randomization sample in this situation, and identify (using the appropriate notation) the sample statistic you would record for each sample.
(Essay)
4.8/5 (40)
Use the following
As of August 8, 2012, the national average price for a gallon of regular unleaded gasoline was $3.63. The prices for a sample of n = 10 gas stations in the state of Illinois are provided.
 It is of interest to use this sample to compare the average gas price in Illinois to the national average.
-Define the appropriate parameter(s) and state the hypotheses for testing if this sample provides evidence that the average gas price in Illinois exceeds the national average.
It is of interest to use this sample to compare the average gas price in Illinois to the national average.
-Define the appropriate parameter(s) and state the hypotheses for testing if this sample provides evidence that the average gas price in Illinois exceeds the national average.
(Essay)
4.9/5 (37)
The null and alternative hypotheses for a test are Ho: p = 0.6 vs. Ha: p > 0.6. Give the notation for a sample statistic we might record for each simulated sample to create the randomization distribution.
(Essay)
4.8/5 (32)
Using a significance level of 5%, the appropriate conclusion for a test with a p-value of 0.0421 would be:
(Multiple Choice)
4.8/5 (36)
Use the following
A certain species of tree has an average life span of 130 years. A researcher has noticed a large number of trees of this species washing up along a beach as driftwood. She takes core samples from 27 of those trees to count the number of rings and measure the widths of the rings. Counting the rings allows the researcher to determine the age of each tree. Her data are displayed in the provided table. One of her interests is determining if this sample provides evidence that the average age of the driftwood is less than the 130 year life span expected for this type of tree. If the average age is less than 130 years it might suggest that the trees have died from unusual causes, such as invasive beetles or logging.
-Describe how you would generate a single randomization sample in this situation, and identify (using the appropriate notation) the sample statistic you would record for each sample.
(Essay)
4.9/5 (39)
Use the following
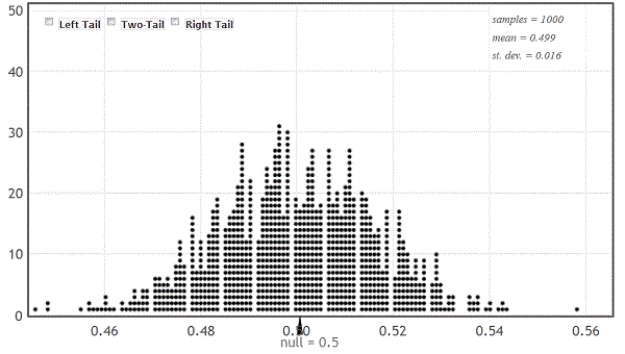
In May 2012, President Obama made history by revealing his support of gay marriage. Around that time, the Gallup Organization polled 1,024 U.S. adults about their opinions on gay/lesbian relations and gay marriage. They found that 54% of those sampled viewed gay/lesbian relations as "morally acceptable" and that 50% felt that gay marriage should be legal.
-Use the provided randomization distribution (based on 1,000 samples) to determine if this sample provides evidence that the majority of Americans find gay/lesbian relations "morally acceptable". Be sure to state the hypotheses, give the p-value, and clearly state the conclusion in context. Include an assessment of the strength of the evidence.
(Essay)
4.7/5 (31)
Use the following
Match each p-value to the most appropriate conclusion.
-________ "There is really no evidence supporting the alternative hypothesis."
(Multiple Choice)
4.8/5 (45)
Use the following
The owner of a small pet supply store wants to open a second store in another city, but he only wants to do so if more than one-third of the city's households have pets (otherwise there won't be enough business). He samples 150 of the households and finds that 64 have pets.
-Define the appropriate parameter(s) and state the hypotheses for testing if this sample provides evidence that more than one-third of households in this city own pets.
(Essay)
5.0/5 (32)
Use the following
There are 24 students enrolled in an introductory statistics class at a small university. As an in-class exercise the students were asked how many hours of television they watch each week. Their responses, broken down by gender, are summarized in the provided table. Assume that the students enrolled in the statistics class are representative of all students at the university.
 -Define the appropriate parameter(s) and state the hypotheses for testing if this sample provides evidence that, on average, male students watch more television than female students at this university.
(Essay)
4.8/5 (42)
Filters
- Essay(0)
- Multiple Choice(0)
- Short Answer(0)
- True False(0)
- Matching(0)