Exam 4: Hypothesis Tests
Exam 1: Collecting Data68 Questions
Exam 2: Describing Data125 Questions
Exam 3: Confidence Intervals148 Questions
Exam 4: Hypothesis Tests119 Questions
Exam 5: Approximating With a Distribution74 Questions
Exam 6: Inference for Means and Proportions166 Questions
Exam 7: Chi-Square Tests for Categorical Variables47 Questions
Exam 8: Anova to Compare Means52 Questions
Exam 9: Inference for Regression123 Questions
Exam 10: Multiple Regression72 Questions
Exam 11: Probability Basics165 Questions
Select questions type
A statistical test uses data from a sample to assess a claim about a population.
(True/False)
4.9/5  (36)
(36)
The significance level,  , represents the tolerable probability of making a Type II error.
(True/False)
4.8/5 (43)
Identify the error in the following hypotheses: Ho: p = 30 versus Ha: p > 30.
(Essay)
4.9/5 (37)
Use the following
Consider testing the hypotheses Ho: p = 0.4 versus Ha: p > 0.4. Four possible sample statistics, along with four possible p-values, are given. Match the statistics to their p-values.
-________ p-value = 0.293
(Multiple Choice)
4.8/5 (35)
Use the following
The owner of a small pet supply store wants to open a second store in another city, but he only wants to do so if more than one-third of the city's households have pets (otherwise there won't be enough business). He samples 150 of the households and finds that 64 have pets.
-Describe how you could generate a single randomization sample in this situation, and identify the statistic that you would calculate for each sample.
(Essay)
4.7/5 (42)
Use the following
A certain species of tree has an average life span of 130 years. A researcher has noticed a large number of trees of this species washing up along a beach as driftwood. She takes core samples from 27 of those trees to count the number of rings and measure the widths of the rings. Counting the rings allows the researcher to determine the age of each tree. The average age of the trees in the sample is approximately 120 years. One of her interests is determining if this sample provides evidence that the average age of the driftwood is less than the 130 year life span expected for this type of tree. If the average age is less than 130 years it might suggest that the trees have died from unusual causes, such as invasive beetles or logging.
-What conclusion would you make at the 10% significance level?
(Essay)
4.9/5 (39)
The provided figure displays the randomization distribution for testing  versus
  .
.
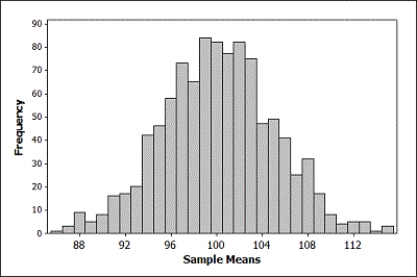 The p-value for the sample mean
  is closest to
(Multiple Choice)
4.8/5 (41)
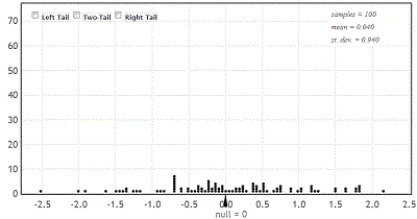
The randomization distribution for testing the hypotheses  versus
  is provided. The sample statistic is
  . Use the provided randomization distribution (based on 100 samples) to estimate the p-value for this test.
(Short Answer)
4.9/5 (30)
Use the following
Consider testing the hypotheses Ho: p = 0.4 versus Ha: p > 0.4. Four possible sample statistics, along with four possible p-values, are given. Match the statistics to their p-values.
-________ p-value = 0.72
(Multiple Choice)
4.9/5 (37)
The average SAT-Critical Reading score for college bound students taking the exam in the 2009-2010 academic year was 501. A highly selective university wants to know if their 2010 incoming class had an average SAT-Critical Reading score that was higher than the national average. Which of the following possible samples provides the most evidence for this claim?
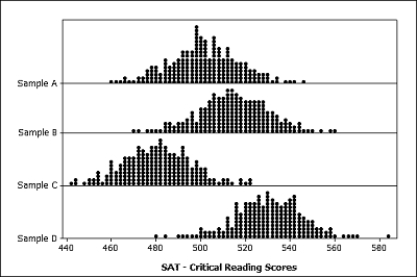
(Multiple Choice)
4.8/5 (42)
Which of the following samples provides the most evidence that the amount of time spent studying for an exam and the grade on the exam are positively correlated? 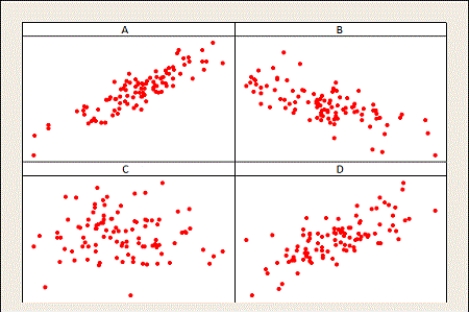
(Multiple Choice)
4.7/5 (36)
Use the following
A certain species of tree has an average life span of 130 years. A researcher has noticed a large number of trees of this species washing up along a beach as driftwood. She takes core samples from 27 of those trees to count the number of rings and measure the widths of the rings. Counting the rings allows the researcher to determine the age of each tree. Her data are displayed in the provided table. One of her interests is determining if this sample provides evidence that the average age of the driftwood is less than the 130 year life span expected for this type of tree. If the average age is less than 130 years it might suggest that the trees have died from unusual causes, such as invasive beetles or logging.
 -Use technology to create a randomization distribution with at least 1,000 values for testing these hypotheses. Use your randomization distribution to estimate the p-value for this sample.
(Essay)
4.8/5 (48)
Use the following
A student in an introductory statistics course investigated if there is evidence that the proportion of milk chocolate M&M's that are green differs from the proportion of dark chocolate M&M's that are green. She purchased a bag of each variety, and her data are summarized in the following table.
 -Use your p-value to make a decision about these hypotheses. Be sure to word your decision in the context of the problem. Include an assessment of the strength of your evidence.
(Essay)
4.9/5 (46)
Use the following
A Division III college men's basketball team is interested in identifying factors that impact the outcomes of their games. They plan to use "point spread"
(their score minus their opponent's score) to quantify the outcome of each game this season; positive values indicate games that they won while negative values indicate games they lost. They want to determine if "steal differential"
(the number of steals they have in the game minus the number of steals their opponent had) is related to point spread; positive values indicate games where they had more steals than their opponent. The data for the first five games are in the provided table as an example.
 The correlation between point spread and steal differential for the n = 25 games they played this season is about r = 0.35. Assuming that this season was a typical season for the team, they want to test if this sample provides evidence that steal differential is positively correlated with point spread.
-Define the appropriate parameter(s) and state the hypotheses for testing if this sample provides evidence that steal differential is positively correlated with point spread.
The correlation between point spread and steal differential for the n = 25 games they played this season is about r = 0.35. Assuming that this season was a typical season for the team, they want to test if this sample provides evidence that steal differential is positively correlated with point spread.
-Define the appropriate parameter(s) and state the hypotheses for testing if this sample provides evidence that steal differential is positively correlated with point spread.
(Essay)
4.9/5 (39)
Use the following
A student in an introductory statistics course investigated if there is evidence that the proportion of milk chocolate M&M's that are green differs from the proportion of dark chocolate M&M's that are green. She purchased a bag of each variety, and her data are summarized in the following table.
 -Define the appropriate parameter(s) and state the hypotheses for testing if the proportion of green M&M's differs for milk chocolate and dark chocolate M&M's.
(Essay)
4.8/5 (42)
Use the following
A study recently described in Attention, Perception, and Psychophysics investigated the impacts of mult-tasking on people who play video games and those who don't. Participants in the study were asked to perform three visually demanding tasks with (dual-task) and without (single-task) answering unrelated questions over the phone. One of the tasks involved tracking multiple circles moving around on a computer monitor. At the 5% significance level, the authors of the study concluded "tracking accuracy was significantly worse in the dual-task condition"
for both people who play video games and those who do not.
-What does the phrase "significantly worse" mean in this context?
(Essay)
4.8/5 (34)
Use the following
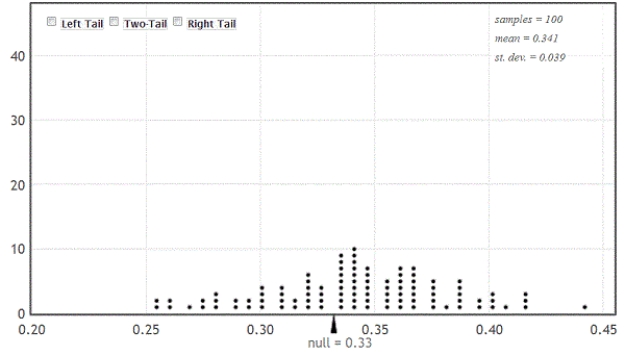
The owner of a small pet supply store wants to open a second store in another city, but he only wants to do so if more than one-third of the city's households have pets (otherwise there won't be enough business). He samples 150 of the households and finds that 64 have pets.
-Use the provided randomization distribution (based on 100 samples) to determine if this sample provides evidence that more than one-third of households in this city own pets. Use a 5% significance level.
(Essay)
4.9/5 (35)
Use the following
A student in an introductory statistics course investigated if there is evidence that the proportion of milk chocolate M&M's that are green differs from the proportion of dark chocolate M&M's that are green. She purchased a bag of each variety, and her data are summarized in the following table.
 -Describe how you would generate a single randomization sample in this situation, and identify (using the appropriate notation) the sample statistic you would record for each sample.
(Essay)
4.8/5 (35)
Filters
- Essay(0)
- Multiple Choice(0)
- Short Answer(0)
- True False(0)
- Matching(0)