Exam 13: Analysis of Categorical Data
Exam 1: Introduction to Statistics17 Questions
Exam 2: Organization and Description of Data53 Questions
Exam 3: Descriptive Study of Bivariate Data44 Questions
Exam 4: Probability54 Questions
Exam 5: Probability Distributions49 Questions
Exam 6: The Normal Distribution32 Questions
Exam 7: Variation in Repeated Samplessampling Distributions31 Questions
Exam 8: Drawing Inferences From Large Samples48 Questions
Exam 9: Small Sample Inferences for Normal Populations36 Questions
Exam 10: Comparing Two Treatments37 Questions
Exam 11: Regression Analysis I29 Questions
Exam 12: Regression Analysis II Multiple Linear Regression and Other Topics5 Questions
Exam 13: Analysis of Categorical Data19 Questions
Exam 14: Analysis of Variance Anova16 Questions
Exam 15: Nonparametric Inference15 Questions
Select questions type
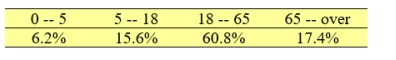
According to the U.S. Census Bureau, one state's population is distributed in the following age groups.
 In one county, the population frequency distribution is
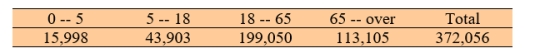 Do these data show a significantly different distribution of the population distribution as compared to that for the entire state? Test at =0.025.
Free
(Short Answer)
4.8/5  (35)
(35)
Correct Answer: Verified
Yes
A car dealer whishes to assess customers' preference among three different colors of new cars. The following frequencies were observed from a random sample of 180 customers inquiries about new models.
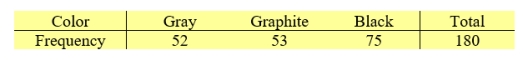 Test the null hypothesis, at α=0.05, that all three colors are equally popular. Answer "H0 is rejected at α=0.05"
or "H0 is not rejected at α=0.05".
Test the null hypothesis, at α=0.05, that all three colors are equally popular. Answer "H0 is rejected at α=0.05"
or "H0 is not rejected at α=0.05".
Free
(Essay)
4.9/5 (40)
Correct Answer:Verified
H0 is not rejected at
α=0.05
In a college cafeteria, students have three options of ice cream, chocolate, vanilla, and mixture of both flavors. Recorded here is the frequency distribution of 120 students' preferences.
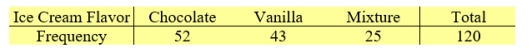 Test the null hypothesis that the probability of the flavor preferences, chocolate, vanilla, mixture, is in the ratios 3:2:1. Use α=0.05. Answer "H0 is rejected at α=0.05"
or "H0 is not rejected at α=0.05".
Test the null hypothesis that the probability of the flavor preferences, chocolate, vanilla, mixture, is in the ratios 3:2:1. Use α=0.05. Answer "H0 is rejected at α=0.05"
or "H0 is not rejected at α=0.05".
Free
(Essay)
4.9/5 (30)
Correct Answer:Verified
H0 is not rejected at
α=0.05
A spinner with four sectors numbered 1, 2, 3, and 4, is spun 200 times. The table below shows the results.
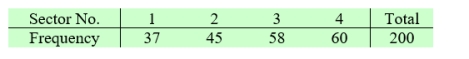 Do these data cast doubt on the fairness of the spinner? Use α=0.05. Answer "H0 is rejected at α=0.05"
or "H0 is not rejected at α=0.05"
Do these data cast doubt on the fairness of the spinner? Use α=0.05. Answer "H0 is rejected at α=0.05"
or "H0 is not rejected at α=0.05"
(Essay)
5.0/5 (39)
A gas station convenience store manager observed that among the 260 customers that entered the store after 11:00 PM from Monday to Wednesday, 190 bought fuel. Among those who bought fuel, 69 persons also purchased milk while only 46 of those that did not buy fuel purchased milk. Conduct a X2 test of independence between purchasing milk and the decision of buying fuel. Use α=0.05.
(Essay)
4.8/5 (43)
Executives of a multinational oil and gas corporation know that among their customers, 40% use 87 octane gasoline, 23% use 89 octane gasoline, 18% use 91 octane gasoline, while the remaining 19% use diesel. A district manager, randomly selects several gas stations in her district and records the type of fuel consumption.
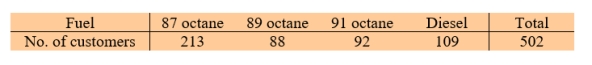 Could these findings be a strong basis for her to write a report about differences from the national figures.? Test at =0.025.
(Short Answer)
4.8/5 (45)
A manufacturer of breakfast cereals, working on new products, selected 50 children to try Cereal A and another 50 to try Cereal
B. Cereal was rated good by 25 of the children and Cereal B was rated good by 35
(a) Make a table that includes both the observed and expected cell frequencies.
(b) Make a table showing the contributions of each cell to the 2
statistic.
(c) Conduct a 2test with = .05. State your conclusion.
(Essay)
4.8/5 (37)
A random sample of 160 students is classified according to gender and ownership of a tablet. Among 80 females in the sample, 14 own a tablet. Further, a total of 40 students in the sample own tablets.
(a) Make a table that includes both the observed and expected cell frequencies.
(b) Make a table showing the contributions of each cell to the 2
statistic.
(c) Conduct a 2 test with = .05. State your conclusion.
(Essay)
4.8/5 (39)
Each person in a random sample of 100 males and each in a random sample of 100 females was asked if they actively created some music by singing or playing an instrument last month. Thirty-two males and forty-eight females participated in a musical activity.
(a) State the null and alternative hypotheses.
(b) Make a table that includes the observed and expected cell frequencies as well as the contributions of each cell to the χ2 statistic.
(c) Conduct a χ2 test with α = .05. State your conclusion.
(Essay)
4.7/5 (27)
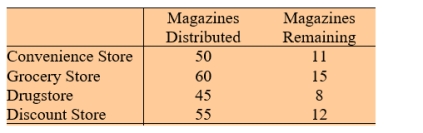
Magazines showing properties for rent in urban areas are delivered through different types of stores. Magazines are distributed at the beginning of the week. In order to optimize the distribution process, a survey was conducted at four different stores in the same neighborhood.
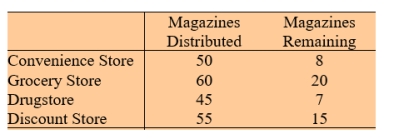 Using the data for convenience and discount stores, test H0: p1 = p4 versus H1: p1 p4 at =0.05 using:
A) The test X2.
B) The Z test
where p1 and p4 denote the probability that a magazine will be taken from a convenience store and a discount store, respectively.
Using the data for convenience and discount stores, test H0: p1 = p4 versus H1: p1 p4 at =0.05 using:
A) The test X2.
B) The Z test
where p1 and p4 denote the probability that a magazine will be taken from a convenience store and a discount store, respectively.
(Essay)
4.8/5 (42)
A pharmaceutical company is testing the effectiveness of two varieties of a new non addictive sleeping aid pill. They observe the time between pill consumption and the moment the individual falls asleep. Among a total of 360 subjects, 180 are given
each variety pill. The following data are collected.
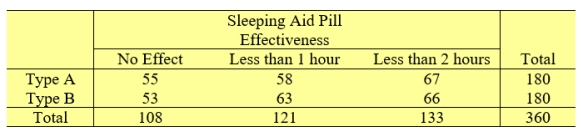 The researchers would like to know if there is a difference in the effectiveness of the two varieties. Conduct a X2 test of the null hypothesis. Use α=0.05.
(Essay)
4.7/5 (40)
A survey was conducted to study people's attitude toward climate change. A random sample of 1300 college graduated was selected and classified according to education level and response to the question: Do you think there is a link between human activities and global warming?
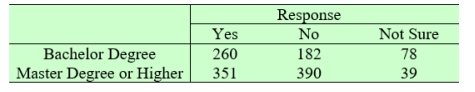 Do the survey data show a significant association between attitude and educational level? Answer "Significantly different", "Not significantly different".
(Short Answer)
4.7/5 (43)
A random sample of 78 sophomores as well as a random sample of 162 non-sophomores
are taken. In this group of 240 college students, 43 are science majors and 35 are sophomore science majors.
A) Complete the two-way table based on these frequencies.
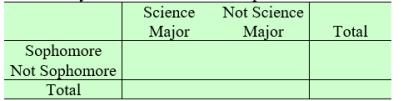 B) Let p1 and p2 be the probabilities that a student is a science major for sophomore and not sophomore, respectively. Consider the null hypothesis H0: p1 = p2. Conduct a X2 test of the null hypothesis. Use =0.05.
(Essay)
4.9/5 (43)
A driver with a valid driver license for at least five years is considered "experienced driver"
by some car insurance companies. The table below shows some statistics about traffic violations and the driver experience level.
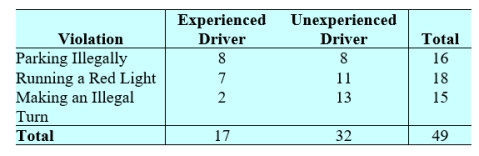 Are type of violation and level of experience associated. Use =0.05.
(Essay)
4.9/5 (39)
Magazines showing properties for rent in urban areas are delivered through different types of stores. Magazines are distributed at the beginning of the week. In order to optimize the distribution process, a survey was conducted at four different stores in the same neighborhood.
 The null hypothesis states that there is no difference in the proportions of magazines taken from each store.
A) Conduct a X2 test of this null hypothesis. Use =0.05.
B) Let P1 denote the probability that a magazine will be taken from a convenience store. Construct a 95% confidence interval for the population proportion P1.
The null hypothesis states that there is no difference in the proportions of magazines taken from each store.
A) Conduct a X2 test of this null hypothesis. Use =0.05.
B) Let P1 denote the probability that a magazine will be taken from a convenience store. Construct a 95% confidence interval for the population proportion P1.
(Essay)
4.8/5 (45)
A survey conducted among 500 professionals who graduated last year, shows the following:
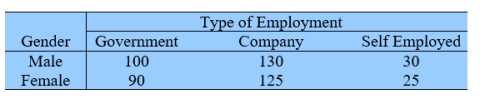 Test the null hypothesis that the gender and the type of employment are independent. Test at α=0.05.
(Essay)
4.8/5 (50)
A new medicated cream will be tested on a sample of females to see if it relieves . The response is either Relief or No Relief. A female control group(no cream) is included in the study. The process is repeated for males. Suppose the data, separated according to gender, are
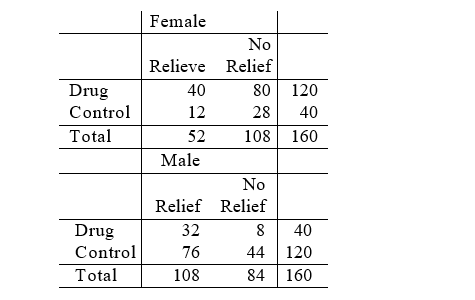 Explain Simpson's paradox in your own words. Illustrate this para- dox with the data on the medicated cream.
(Not Answered)
This question doesn't have any answer yet
One hundred pairs of glasses were purchase from on-line stores. The lenses were subjected to an optical test and an impact test.
Suppose the results are
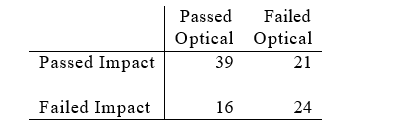 (a) State the null and alternative hypotheses.
(b) Make a table that includes the observed and expected cell frequencies as well as the contributions of each cell to the 2 statistic.
(c) Conduct a 2 test with = .05. State your conclusion.
(a) State the null and alternative hypotheses.
(b) Make a table that includes the observed and expected cell frequencies as well as the contributions of each cell to the 2 statistic.
(c) Conduct a 2 test with = .05. State your conclusion.
(Essay)
4.9/5 (35)
A personal development seminar was attended by 190 person with low self-esteem and 202 with medium self-esteem. At the conclusion of the seminar, the motivational speaker asked participants whether their self-esteem improved or not. The organizers claim that both groups are not equally benefited by attending the seminar.
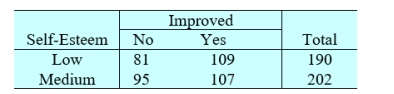 Confirm that these data establish a difference in the proportions who did not benefit by attending the seminar using:
A) The X2 test with level =0.01.
B) The Z test with level =0.01.
Confirm that these data establish a difference in the proportions who did not benefit by attending the seminar using:
A) The X2 test with level =0.01.
B) The Z test with level =0.01.
(Essay)
4.8/5 (37)
Filters
- Essay(0)
- Multiple Choice(0)
- Short Answer(0)
- True False(0)
- Matching(0)