Exam 11: Regression Analysis I
Exam 1: Introduction to Statistics17 Questions
Exam 2: Organization and Description of Data53 Questions
Exam 3: Descriptive Study of Bivariate Data44 Questions
Exam 4: Probability54 Questions
Exam 5: Probability Distributions49 Questions
Exam 6: The Normal Distribution32 Questions
Exam 7: Variation in Repeated Samplessampling Distributions31 Questions
Exam 8: Drawing Inferences From Large Samples48 Questions
Exam 9: Small Sample Inferences for Normal Populations36 Questions
Exam 10: Comparing Two Treatments37 Questions
Exam 11: Regression Analysis I29 Questions
Exam 12: Regression Analysis II Multiple Linear Regression and Other Topics5 Questions
Exam 13: Analysis of Categorical Data19 Questions
Exam 14: Analysis of Variance Anova16 Questions
Exam 15: Nonparametric Inference15 Questions
Select questions type
The price y (in cents) of a domestic long distance telephone call is given by
y = 2x + 25
where x denotes the number of minutes that the call lasts.
A) What is the price, in dollars, of a 33 minutes call?
B) If the telephone company charged you $3.33 for a domestic long distance call, how long was that call?
Free
(Short Answer)
4.7/5  (27)
(27)
Correct Answer: Verified
Part A: $0.91
Part B: 154 minutes
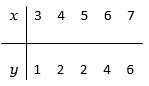
Consider the data
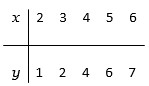 (a) Calculate the least squares estimates 1 and 0.
(b) Estimate the error variance.
(c) Obtain a 95 % confidence interval for 1. Can you conclude that the slope is different from 0?
(d) Determine the proportion of variation in y explained by x.
(a) Calculate the least squares estimates 1 and 0.
(b) Estimate the error variance.
(c) Obtain a 95 % confidence interval for 1. Can you conclude that the slope is different from 0?
(d) Determine the proportion of variation in y explained by x.
Free
(Short Answer)
4.9/5 (27)
Correct Answer:Verified
(a) 1 = 1.6 and 0 = - 2.4 so y = -2.4 + 1.6 x
(b) .1333
(c) ( 1.37 , 1.83 ).
(d) .9846
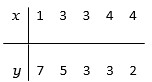
Consider the data set 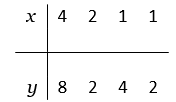 Calculate the
(a) sample means
(b) Sxx , Sxy , Syy
(c) Calculate the least squares estimates β1 and β0.
(d) Calculate the sample correlation coefficient.
Calculate the
(a) sample means
(b) Sxx , Sxy , Syy
(c) Calculate the least squares estimates β1 and β0.
(d) Calculate the sample correlation coefficient.
Free
(Short Answer)
4.9/5 (36)
Correct Answer:Verified
(a) 2 and 4
(b) Sxx = 6, Sxy = 10 and Syy = 24
(c) β1 = 1.667 and β0 = .667 (d) .8333
The letter x usually represents the independent variable, also called predictor variable
(True/False)
4.8/5 (38)
The total number of hours worked by a student, y, last week depends on the number of days, x, they worked. Data on twenty-eight students produce the summary statistics
n = 28 = 3.21 = 14.79 Sxx = 2260.714 Sxy = 1969.286 Syy = 2076.714
Determine the proportion of variation in y that is explained by linear regression. Round your answer to three decimal places.
(Short Answer)
4.8/5 (33)
A basketball fan collected data on the number of points per game, y, of her favorite player, associated with the number of minutes, x, played per game
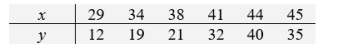 Given that
Sxx = 189.50, Sxy 317.50, and Syy 581.50, calculate the residual sum of squares S.S.E.
Given that
Sxx = 189.50, Sxy 317.50, and Syy 581.50, calculate the residual sum of squares S.S.E.
(Short Answer)
4.7/5 (32)
Consider the following data set:
 where Sxx = 10 , Sxy = 25, and Syy = 74.Construct a 90% confidence interval for the intercept 0. Round your answer to three decimal places.
(Short Answer)
4.7/5 (43)
Under the linear regression model, determine the (A) mean and (B) standard deviation of Y, for x = 12, when β0 = 6, β1 = 5, and δ = 7.
(Short Answer)
4.9/5 (42)
A recent graduate moving to a new job, collected a sample of rent (dollars) and size (square feet) of 2-bedroom apartments in a desirable area of the city. The data
have the summary statistics
We randomly selected 12 countries, of about 200 countries on the list. H.D.I. is the response variable y, and total fertility rate (births per woman), x, is the predictor variable. The data have the summary statistics.
n = 8 = 1072.25 = 1421.25 Sxx = 230081.5 Syy = 217237.5
Sxy = 212376.5
Determine the equation of the best fitting straight line. Round your answer to three decimal places.
(Short Answer)
4.9/5 (34)
The Human Development Index (H.D.I.) provides a composite measure of three dimensions of human development: life expectancy, adult literacy, and income. One county's H.D.I. trend is shown below.
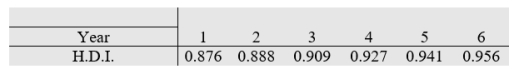 A) Determine the equation of the least squares regression line.
B) Estimate the H.D.I. in year 6.5.
C) Construct a 95% confidence interval for the response in part B. Round your answer to three decimal places.
A) Determine the equation of the least squares regression line.
B) Estimate the H.D.I. in year 6.5.
C) Construct a 95% confidence interval for the response in part B. Round your answer to three decimal places.
(Short Answer)
5.0/5 (36)
Consider the following information:
n = 19 = 9.959 = 0.6679 Sxx = 1173.45 Sxy = 20.480 Syy = 0.41771
A) If x is the predictor variable, determine the proportion of variation in y, that is explained by linear regression.
B) If y is the predictor variable, determine the proportion of variation in x, that is explained by linear regression.
Round your answers to three decimal places.
(Short Answer)
4.8/5 (42)
Consider the following linear regression model
Y = β0 + β1x + e
where β0 = 4, β1 = -2, and the normal random variable e, has the standard deviation 3.
A) What is the mean of the response Y when x = 8?
B) Will the response at x = 9 always be larger than that at x = 8? Answer "Yes" or "No".
(Short Answer)
4.8/5 (32)
Data on the number of cans of beverage served, y , and the number of students, x, attending a TV watching party were recorded on six occassions
 A) Calculate
B) Calculate
C) Calculate Sxx
D) Calculate Syy
E) Calculate Sxy
Calculate the least squares estimate
A) Calculate
B) Calculate
C) Calculate Sxx
D) Calculate Syy
E) Calculate Sxy
Calculate the least squares estimate
 G) Calculate the least squares estimate

(Short Answer)
4.9/5 (38)
Data on the number of cans of beverage served, y , and the number of students, x, attending a TV watching party were recorded on six occassions
 Find the value of
  . Round your answer to three decimal places.
(Multiple Choice)
4.8/5 (41)
Temperature anomaly means a departure from a reference value, usually obtained by a long-term average. A positive anomaly indicates that the observed temperature was warmer than the reference value. The following table shows the annual anomalies for the highest temperatures in six recent decades..
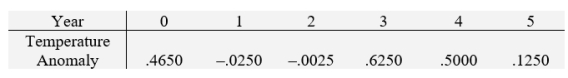 A) Obtain the last squares fit of year to the predictor temperature anomaly.
B) Calculate the residual sum of squares.
C) Estimate .
A) Obtain the last squares fit of year to the predictor temperature anomaly.
B) Calculate the residual sum of squares.
C) Estimate .
 Round your answers to three decimal places.
(Short Answer)
4.7/5 (34)
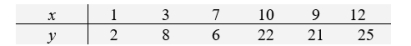
Consider the data
 (a) Calculate the least squares estimates 1 and 0.
(b) Estimate the error variance.
(c) Obtain a 95 % confidence interval for 1. Can you conclude that the slope is different from 0?
(d) Find a 95% confidence interval for the mean response when
x = 8.
(a) Calculate the least squares estimates 1 and 0.
(b) Estimate the error variance.
(c) Obtain a 95 % confidence interval for 1. Can you conclude that the slope is different from 0?
(d) Find a 95% confidence interval for the mean response when
x = 8.
(Short Answer)
4.9/5 (45)
Which of the following statements is (are) true?
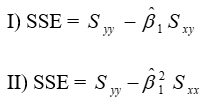 III) The point ( , ) lies on the fitted regression line
(Multiple Choice)
4.9/5 (32)
Consider the line y = -6 + 14x
A) What is its intercept?
B) What is its slope?
(Short Answer)
4.8/5 (36)
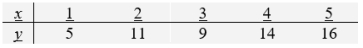
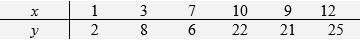
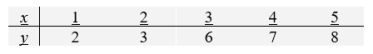
Consider the data set
 Calculate the
(a) sample means.
(b) Sxx , Sxy Syy.
(c) Calculate the least squares estimates 1 and 0.
(d) Estimate the error variance.
(e) Determine the proportion of variation in y explained by x.
Calculate the
(a) sample means.
(b) Sxx , Sxy Syy.
(c) Calculate the least squares estimates 1 and 0.
(d) Estimate the error variance.
(e) Determine the proportion of variation in y explained by x.
(Short Answer)
4.9/5 (37)
Consider the following data set.
 where Sxx = 10, Sxy = 16, and Syy = 26.8. Construct a 95% confidence interval for 1 . Round your answer to two decimal places.
(Short Answer)
4.8/5 (37)
Filters
- Essay(0)
- Multiple Choice(0)
- Short Answer(0)
- True False(0)
- Matching(0)