Exam 3: Descriptive Study of Bivariate Data
Exam 1: Introduction to Statistics17 Questions
Exam 2: Organization and Description of Data53 Questions
Exam 3: Descriptive Study of Bivariate Data44 Questions
Exam 4: Probability54 Questions
Exam 5: Probability Distributions49 Questions
Exam 6: The Normal Distribution32 Questions
Exam 7: Variation in Repeated Samplessampling Distributions31 Questions
Exam 8: Drawing Inferences From Large Samples48 Questions
Exam 9: Small Sample Inferences for Normal Populations36 Questions
Exam 10: Comparing Two Treatments37 Questions
Exam 11: Regression Analysis I29 Questions
Exam 12: Regression Analysis II Multiple Linear Regression and Other Topics5 Questions
Exam 13: Analysis of Categorical Data19 Questions
Exam 14: Analysis of Variance Anova16 Questions
Exam 15: Nonparametric Inference15 Questions
Select questions type
Usually, the predictor or ______ variable is denoted by the letter ______.
Free
(Short Answer)
4.7/5  (38)
(38)
Correct Answer: Verified
input, x
An experimental study of the relation between two variables is often motivated by a need to predict one from the other. The first step in such a study is to plot and examine the scatter diagram.
Free
(True/False)
4.7/5 (35)
Correct Answer:Verified
True
The numerical value of r indicates how effectively y can be predicted from x.
Free
(True/False)
4.9/5 (40)
Correct Answer:Verified
True
Observations on two or more variables recorded for the individual sampling units are called ______ or multivariate data.
(Short Answer)
4.9/5 (39)
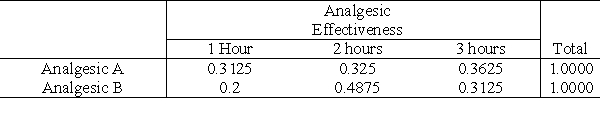
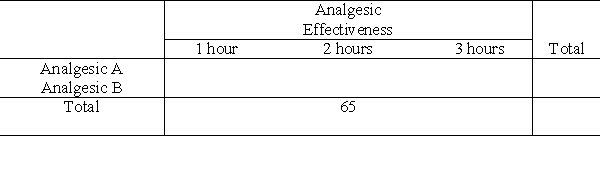
Final grades of students enrolled in an Introductory Statistics course are summarized below.
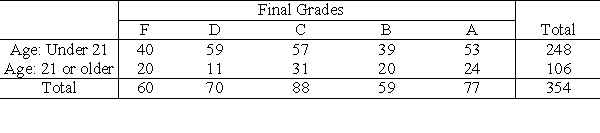 Complete the following table by calculating the relative frequencies separately for each row. Round your answers to three decimal places.
(Essay)
4.9/5 (39)
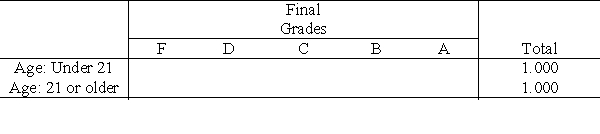
In a group of 280 college students, 55 are science majors, 86 are freshmen, and 50 are both. Based on these data, calculate the relative frequencies.
(Essay)
4.8/5 (40)
The false correlation produced by a lurking variable is called ________ correlation.
(Short Answer)
4.9/5 (32)
Final grades of students enrolled in a Introductory Statistics course are summarized below.
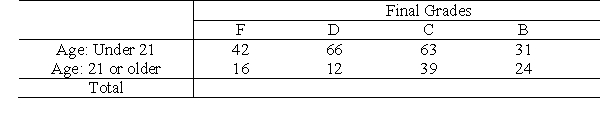 Calculate the remaining marginal totals.
(Multiple Choice)
4.8/5 (40)
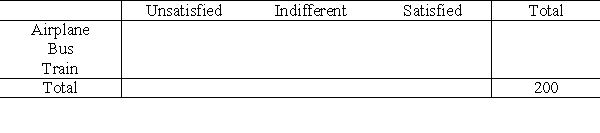
A survey was conducted to study the degree of satisfaction with the service of passengers from New York City to Washington D.C. The following table shows the relative frequencies.
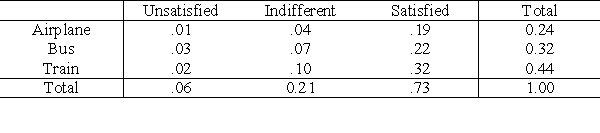 Complete the table of cross-tabulated frequencies.
(Essay)
4.9/5 (47)
The value of the correlation coefficient r, is always between -1 and ______.
(Short Answer)
4.8/5 (40)
In an experiment to study the relation between the speed of an athlete running 100 meters, y (meters/second) and the environment temperature, x (Celsius degrees), her trainer collected the following statistics:
 Find the equation of the least squares fitted line.
(Short Answer)
4.8/5 (31)
In statistical terminology, contingency tables correspond to cross-classified or cross-tabulated data.
(True/False)
4.9/5 (34)
In the following instance, would you expect a positive, negative, or zero correlation?
The size of an apartment and the sex of the tenant.
(Short Answer)
4.9/5 (33)
The magnitude of the correlation coefficient r, indicates the strength of a linear relation.
(True/False)
4.9/5 (38)
Given the following table of relative frequencies by row, complete the table of cross-tabulated frequencies.
(Essay)
4.8/5 (35)
A fabric manufacturer has determined that the resistance y of a fiber is given by
y = 18x - 155
where x (in grams) denotes the amount of a synthetic compound used to make the fiber.
A) If 44 grams of the synthetic compound are used, what is the resistance?
B) At least how many grams of synthetic compound must be used to have a positive resistance?
(Short Answer)
4.8/5 (36)
Filters
- Essay(0)
- Multiple Choice(0)
- Short Answer(0)
- True False(0)
- Matching(0)