Exam 2: Organization and Description of Data
Exam 1: Introduction to Statistics17 Questions
Exam 2: Organization and Description of Data53 Questions
Exam 3: Descriptive Study of Bivariate Data44 Questions
Exam 4: Probability54 Questions
Exam 5: Probability Distributions49 Questions
Exam 6: The Normal Distribution32 Questions
Exam 7: Variation in Repeated Samplessampling Distributions31 Questions
Exam 8: Drawing Inferences From Large Samples48 Questions
Exam 9: Small Sample Inferences for Normal Populations36 Questions
Exam 10: Comparing Two Treatments37 Questions
Exam 11: Regression Analysis I29 Questions
Exam 12: Regression Analysis II Multiple Linear Regression and Other Topics5 Questions
Exam 13: Analysis of Categorical Data19 Questions
Exam 14: Analysis of Variance Anova16 Questions
Exam 15: Nonparametric Inference15 Questions
Select questions type
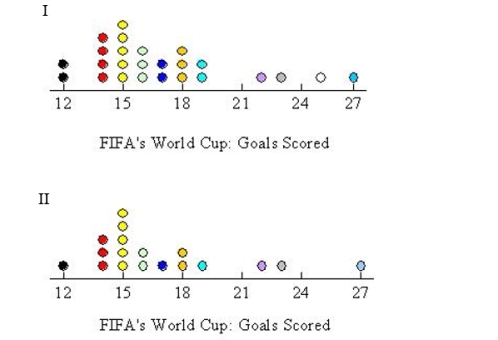
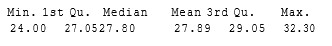
The top number of goals scored by a national team in 18 FIFA's World Cups is shown below. Select the dot diagram that matches with the data.

Free
(Short Answer)
4.8/5  (38)
(38)
Correct Answer: Verified
II
Find the standard deviation of the following data set. 
Free
(Multiple Choice)
4.8/5 (33)
Correct Answer:Verified
A
Consider the software summary of the data on the length of a wolf's Canine(mm).
n = 19
sd(x) = 1.969
 (a) sample range
(b) sample interquartile range.
(c)
(a) sample range
(b) sample interquartile range.
(c)
Free
(Short Answer)
4.7/5 (42)
Correct Answer:Verified
(a) 8.3
(b) 2.00
(c) (23.95 , 31.83)
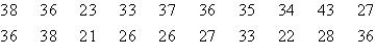
A report on the points gained by football teams playing at home in week 2 of the season are summarized below.
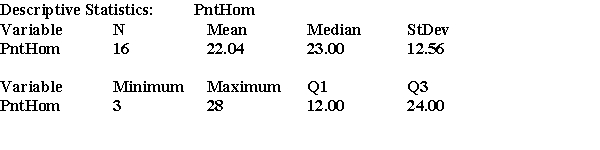 a) Calculate the sample variance.
b) Calculate the interquartile range.
a) Calculate the sample variance.
b) Calculate the interquartile range.
(Short Answer)
4.8/5 (38)
If M is the mean of x1, x2, and x3, then the mean of x1 + 3, x2 + 3, and x3 + 3 is M + 3.
(True/False)
4.8/5 (39)
A football fan recorded the total number of points scored by 5 teams during week 1.
 a) Calculate the sample variance.
b) Calculate the sample standard deviation.
a) Calculate the sample variance.
b) Calculate the sample standard deviation.
(Short Answer)
4.8/5 (38)
In a recent basketball season, one-star player scored 475 field goals, 4 3-point field goals, and 292 free-throw goals. Find the pie chart that better describes the data.
(Multiple Choice)
4.9/5 (34)
Five students reported the number of canned/bottled beverages they consumed last week
3 7 3 11 1
Calculate the
(a) sample mean
(b) deviations x - x and check to see that they add up to 0.
(c) sample variance. Give the units of variance.
(d) sample standard deviation.
(Short Answer)
4.7/5 (45)
Refer to the data.
 a) Calculate and s.
b) Find the proportion of the observations that are in the intervals , , and .
a) Calculate and s.
b) Find the proportion of the observations that are in the intervals , , and .
(Essay)
4.7/5 (44)
The following data represents the Tampa Buccaneers number of touchdowns per season, in 20 seasons. Make a stem-and-leaf display.
(Essay)
4.8/5 (28)
For the data concerning the number of chemistry class discussion sections skipped by 5 students last semester.
1 3 4 9 3
Calculate the
(a) sample mean
(b) deviations x- x and check to see that they add up to 0.
(c) sample variance. Give the units of variance.
(d) sample standard deviation.
(Short Answer)
5.0/5 (38)
The table below shows the attendance to the Super Bowl for 14 years
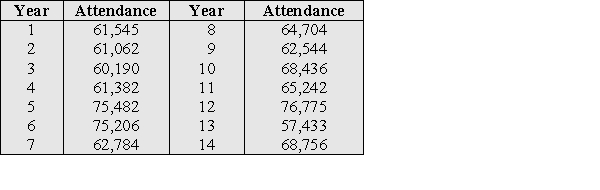 a) Find the 10th percentile.
b) Find the interquartile range.
a) Find the 10th percentile.
b) Find the interquartile range.
(Short Answer)
4.8/5 (32)
Both, categorical and numerical data can be described graphically using tables and ______.
(Short Answer)
4.9/5 (38)
For the data set 6 10 1
a) Calculate the deviations (X-X̄) . Round your answers to two decimal places.
b) Calculate the sample variance and the standard deviation.
(Short Answer)
4.7/5 (41)
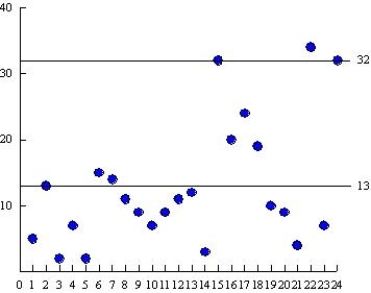
During a recent regular season, the Orlando magics basketball team won 59 games. The difference of points in 24 of these games is shown below. Find the control chart that corresponds to these data.
 I
I
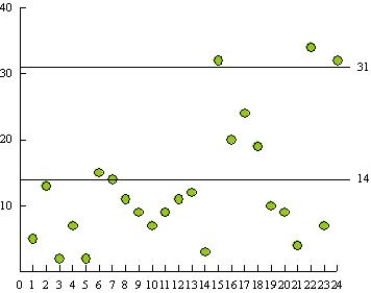 II
II
(Short Answer)
4.7/5 (31)
Calculate the mean and median of the following data set. Round your answer to the nearest tenth. 
(Multiple Choice)
4.9/5 (26)
In describing a data set of measurements, the computation of numerical measures is irrelevant.
(True/False)
4.9/5 (38)
The second quartile of a data set always corresponds to the median.
(True/False)
4.7/5 (33)
Filters
- Essay(0)
- Multiple Choice(0)
- Short Answer(0)
- True False(0)
- Matching(0)