Exam 12: Regression Analysis II Multiple Linear Regression and Other Topics
Exam 1: Introduction to Statistics17 Questions
Exam 2: Organization and Description of Data53 Questions
Exam 3: Descriptive Study of Bivariate Data44 Questions
Exam 4: Probability54 Questions
Exam 5: Probability Distributions49 Questions
Exam 6: The Normal Distribution32 Questions
Exam 7: Variation in Repeated Samplessampling Distributions31 Questions
Exam 8: Drawing Inferences From Large Samples48 Questions
Exam 9: Small Sample Inferences for Normal Populations36 Questions
Exam 10: Comparing Two Treatments37 Questions
Exam 11: Regression Analysis I29 Questions
Exam 12: Regression Analysis II Multiple Linear Regression and Other Topics5 Questions
Exam 13: Analysis of Categorical Data19 Questions
Exam 14: Analysis of Variance Anova16 Questions
Exam 15: Nonparametric Inference15 Questions
Select questions type
Suppose the price, y, per ton of copper can be modeled by 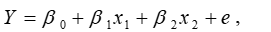 where the two predictor variables x1 and x2 are the prices per ton of zinc and lead, respectively. The least squares estimates, based on monthly observations in a five-year period, are:
 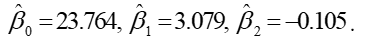 Assuming that the residual sum of squares (SSE) is 1424.48 and the SS due to regression is 5150.68.
A) Estimate the error standard deviation.
B) State the degrees of freedom used in part A.
C) Find R2.
Assuming that the residual sum of squares (SSE) is 1424.48 and the SS due to regression is 5150.68.
A) Estimate the error standard deviation.
B) State the degrees of freedom used in part A.
C) Find R2.
Free
(Essay)
4.7/5  (38)
(38)
Correct Answer: Verified
Part A: 24.301
Part B: 57
Part C: 0.783
Consider the data set
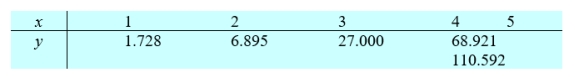 A) Obtain the best fitting straight line with
  B) What proportion of the y'variability is explained by the fitted line?
Round your answers to three decimal places.
B) What proportion of the y'variability is explained by the fitted line?
Round your answers to three decimal places.
Free
(Essay)
4.8/5 (34)
Correct Answer:Verified
Part A:  = .180 - 1.940x
Part B: .993
Find a linearizing transformation of y=1/(a + b x)
Free
(Short Answer)
4.8/5 (43)
Correct Answer:Verified
y' = 1/y, x' = x
Suppose the price, y, per ton of copper can be modeled by 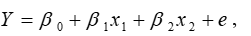 where the two predictor variables x1 and x2 are the prices per ton of zinc and lead, respectively. The least squares estimates are:
 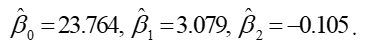 Predict the response for x1= 2389 and x2 = 2366.
(Short Answer)
4.8/5 (42)
Consider the multiple linear regression model
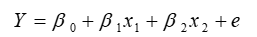 where
where 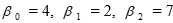 , and the normal random variable e has standard deviation 6. What is the mean of the response Y when x1 = 1 and x2 = 4?
(Multiple Choice)
4.8/5 (37)
Filters
- Essay(0)
- Multiple Choice(0)
- Short Answer(0)
- True False(0)
- Matching(0)