Exam 13: Correlation Research
Exam 1: The Nature of Scientific Inquiry80 Questions
Exam 2: The Scientific Approach in Education99 Questions
Exam 3: he Research Problem65 Questions
Exam 4: Reviewing the Literature61 Questions
Exam 5: The Hypothesis106 Questions
Exam 6: Descriptive Statistics80 Questions
Exam 7: Sampling and Inferential Statistics113 Questions
Exam 8: Tools of Research136 Questions
Exam 9: Validity and Reliability139 Questions
Exam 10: Experimental Research138 Questions
Exam 11: Experimental Research Design93 Questions
Exam 12: Ex Post Facto Research83 Questions
Exam 13: Correlation Research121 Questions
Exam 14: Survey Research125 Questions
Exam 15: Defining and Designing Qualitative Research78 Questions
Exam 16: Types of Qualitative Research108 Questions
Exam 17: Analyzing and Reporting Qualitative Research101 Questions
Exam 18: Action Research93 Questions
Exam 19: Mixed Methods Research45 Questions
Exam 20: Guidelines for Writing Research Proposals101 Questions
Exam 21: Interpreting and Reporting Results of Quantitative Research113 Questions
Select questions type
A general aptitude test correlates .45 with success in a particular college.To improve the predictive accuracy, the students are also given three other aptitude measures, all of which correlate very highly with one another and with the first test.What will be the likely effect of adding the scores from the three additional tests to the regression equation?
(Multiple Choice)
4.9/5  (36)
(36)
If a computed Pearson's correlation coefficient is statistically significant at the .01 level,
(Multiple Choice)
4.8/5 (40)
Why would a correlation of -.5 be just as useful as a correlation of .5?
(Essay)
4.9/5 (35)
A study with college students found no correlation between hours of study for an examination and test performance.This probably means
(Multiple Choice)
4.9/5 (43)
Exhibit 13-6: A researcher collects the following measures on a sample of college students: scores on the SAT and the ACT, scores on an English composition test, high school class rank, scores on a noncognitive measure, whether or not students successfully completed the first year of college (pass-fail), and their GPA.Choose the statistical procedures that the researcher should use to answer the following questions.
-Refer to Exhibit 13-6.What is the correlation between the combination of independent variables and GPA at the end of the freshman year as dependent variable?
(Multiple Choice)
4.8/5 (29)
Exhibit 13-6: A researcher collects the following measures on a sample of college students: scores on the SAT and the ACT, scores on an English composition test, high school class rank, scores on a noncognitive measure, whether or not students successfully completed the first year of college (pass-fail), and their GPA.Choose the statistical procedures that the researcher should use to answer the following questions.
-Refer to Exhibit 13-6.Do all the measures used in this study measure something in common?
(Multiple Choice)
4.8/5 (30)
Exhibit 13-3: Compare the following coefficients of correlation and their corresponding Ns, then answer the questions.Notice that all correlation values are statistically significant.
-Refer to Exhibit 13-3.Which coefficient of correlation is least significant?
(Multiple Choice)
4.9/5 (30)
If a test is going to predict a criterion well, the correlation between the test and the criterion should be
(Multiple Choice)
4.9/5 (39)
A researcher found a correlation of .40 between aptitude test scores and school achievement.What proportion of the variance in school achievement can be attributed to variables other than aptitude?
(Multiple Choice)
4.7/5 (27)
Assume you are using GRE scores and undergraduate grades to predict graduate GPA.If the correlation of GRE scores and undergraduate grades were .18 rather than .56, then GRE scores would be ____ for predicting graduate GPA.
(Multiple Choice)
4.8/5 (40)
In a sample of 18, the correlation between intelligence test scores and creativity test scores was found to be .40.Do these data provide evidence for a significant relationship between these variables in the population? Test at the .05 level of significance (two tailed).Table A5 shows a correlation of .4683 for 16 degrees of freedom.
(Multiple Choice)
4.9/5 (30)
The process of applying a prediction equation to another sample independent of the sample on which the equation was calculated is called
(Multiple Choice)
4.7/5 (32)
If a relationship between two variables is spurious, we conclude that it is
(Multiple Choice)
4.7/5 (53)
One wants to find the correlation between social adjustment and achievement with the effects of intelligence controlled.The appropriate index to use is
(Multiple Choice)
4.8/5 (33)
The correlation between SAT and GPA would be lowest for which one of the following populations?
(Multiple Choice)
4.7/5 (36)
The following graph resulted when a researcher plotted the paired scores from two sets of data: 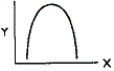 Which of the following conclusions is justified from an examination of the graph?
(Multiple Choice)
4.9/5 (39)
The correlation between the Graduate Record Examination (GRE) and undergraduate GPA for all people taking the GRE is .56.If the correlation is recomputed for only those students admitted to graduate school, the value of the correlation will most likely
(Multiple Choice)
4.9/5 (42)
Other things being equal, as the sample size increases the critical value for the Pearson's r
(Multiple Choice)
4.9/5 (36)
Filters
- Essay(0)
- Multiple Choice(0)
- Short Answer(0)
- True False(0)
- Matching(0)