Exam 14: Univariate and Bivariate Analysis of Quantitative Data
Exam 1: The Art and Science of Social Research: An Introduction58 Questions
Exam 2: Research Foundations: Linking Sociological Theory to Research57 Questions
Exam 3: Ethical Issues in Social Science Research59 Questions
Exam 4: From Concepts to Models: Hypotheses, Operationalization, and Measurement55 Questions
Exam 5: Evaluating Research: Reliability and Validity39 Questions
Exam 6: Sampling Strategies48 Questions
Exam 8: Experimental Research69 Questions
Exam 9: Evaluation Research45 Questions
Exam 10: Ethnography59 Questions
Exam 11: In-Depth Interviewing59 Questions
Exam 12: Materials-Based Methods61 Questions
Exam 13: Social Network Analysis61 Questions
Exam 14: Univariate and Bivariate Analysis of Quantitative Data54 Questions
Exam 15: Multivariate and Advanced Quantitative Methods55 Questions
Exam 16: Analysis of Qualitative Data55 Questions
Exam 17: Communicating Social Science Research Findings57 Questions
Select questions type
________ show the 95% confidence intervals for conditional means.
(Multiple Choice)
4.7/5  (31)
(31)
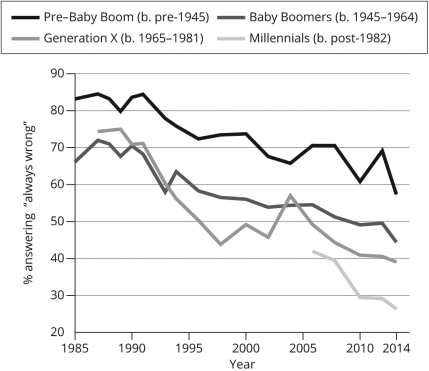
As this graph notes,there are big differences between cohorts,but since 1985 each cohort has also become more tolerant toward gay people over time.What type of effect is demonstrated with the increased tolerance over time within cohort?
(Multiple Choice)
5.0/5 (40)
Radka has collected data on the conditional mean of weekly hours of exercise,comparing those under 75 years of age and those 75 years or older.She observes a higher mean number of weekly exercise hours for the younger group.Because the sample of respondents 75 or older is much smaller than the sample of those under 75,the error bar is much wider for the older than for the younger respondents.Radka needs to check for whether the two groups' error bars overlap,because if they do,
(Multiple Choice)
4.9/5 (42)
Compare and contrast bivariate regression analysis to correlation.Offer one point of comparison and one point of contrast.
(Essay)
4.7/5 (33)
Dr.Anderson has collected information on whether respondents voted in the 2016 presidential election.There are two answer choices (yes or no).Can she report a mean for this variable?
(Multiple Choice)
4.7/5 (35)
Jerome has surveyed his friends to see the number of meals they've eaten at McDonald's in the past month.He received the following responses: 2,3,1,2,4,2,and 12.Twelve is an example of a/an
(Multiple Choice)
4.7/5 (31)
Define the terms standard deviation and percentiles.Then,evaluate which measure you think best describes variation to the average American.Justify your choice.
(Essay)
4.9/5 (36)
Dr.Liu wants to learn how well the students in his research methods class performed on their final exam.He added together all 25 exam scores and then divided by 25.What measure of central tendency did Dr.Liu calculate?
(Multiple Choice)
4.8/5 (24)
Monique has collected data on how frequently students skip class at her university.She asked respondents to report the exact number of classes skipped in the past semester.She wants to create a graph to display the distribution of responses.What type of graph should she create?
(Multiple Choice)
4.7/5 (26)
Benjamin is studying the influence of age on weekly hours of television viewing.Using a statistical software program to estimate the slope for age on voting,he derives the following regression equation:
Weekly TV Hours = 2.35 + (0.16 * Age)
As your textbook notes,the regression coefficient,or slope,can be used to calculate
The expected value of the dependent variable (in this case,TV hours)for a given
Value of the independent variable (in this case,age).If a person is 63 years old,what would his or her expected number of TV hours be?
(Multiple Choice)
4.7/5 (31)
Bivariate regression analysis expresses the ________ as a simple function of the ________.
(Multiple Choice)
4.8/5 (32)
Data from the General Social Survey reveals that as Americans grow older,they profess to be more religious.This is an example of a(n)________ effect.
(Multiple Choice)
4.8/5 (34)
A study uses a repeated cross-sectional survey to study changes in attitudes toward nonmarital cohabitation over time.The results show that in more recent years,people have become more accepting of unmarried couples living together.To the extent that this increased acceptance is due to cohort replacement,the feature of the cross-sectional design that helps us to understand the change in attitudes over time is that repeated cross-sectional surveys
(Multiple Choice)
4.8/5 (40)
Knowing a variable's ________ is incredibly valuable;it allows us to talk about possible values,averages,and variation,as well as describe differences among groups.
(Multiple Choice)
4.9/5 (32)
Luna surveyed 5,000 public defenders in five U.S.cities and asked them to report their monthly incomes.If Luna has accurately determined that the median is the most appropriate measure of central tendency for this sample,this tells us that the income scores had a
(Multiple Choice)
4.9/5 (34)
Dr.Liu wants to learn how well the students in his research methods class performed on their final exam.He ranked the 25 exam scores in order from lowest to highest,and then he examined the middle score.What measure of central tendency did Dr.Liu calculate?
(Multiple Choice)
4.8/5 (40)
Using an example,distinguish between an age effect and a period effect.
(Essay)
4.8/5 (30)
You are presenting results of a study on income inequality to the local community,the members of which have little to no statistical training.Which measure of variation would be the best for you to use to describe the variation in income to the community?
(Multiple Choice)
4.8/5 (31)
Filters
- Essay(0)
- Multiple Choice(0)
- Short Answer(0)
- True False(0)
- Matching(0)