Exam 3: Interdependence and the Gains From Trade
Exam 1: Ten Principles of Economics347 Questions
Exam 2: Thinking Like an Economist535 Questions
Exam 3: Interdependence and the Gains From Trade442 Questions
Exam 4: The Market Forces of Supply and Demand569 Questions
Exam 5: Elasticity and Its Application503 Questions
Exam 6: Supply, Demand, and Government Policies556 Questions
Exam 7: Consumers, Producers, and the Efficiency of Markets460 Questions
Exam 8: Application: The Costs of Taxation422 Questions
Exam 9: Application: International Trade409 Questions
Exam 10: Measuring a Nations Income428 Questions
Exam 11: Measuring the Cost of Living436 Questions
Exam 12: Production and Growth417 Questions
Exam 13: Saving, Investment, and the Financial System473 Questions
Exam 14: The Basic Tools of Finance419 Questions
Exam 15: Unemployment571 Questions
Exam 16: The Monetary System423 Questions
Exam 17: Money Growth and Inflation388 Questions
Exam 18: Open-Economy Macroeconomic Models448 Questions
Exam 19: A Macroeconomic Theory of the Open Economy374 Questions
Exam 20: Aggregate Demand and Aggregate Supply471 Questions
Exam 21: The Influence of Monetary and Fiscal Policy on Aggregate Demand416 Questions
Exam 22: The Short-Run Trade-Off Between Inflation and Unemployment400 Questions
Exam 23: Six Debates Over Macroeconomic Policy235 Questions
Select questions type
Figure 3-11
The graph below represents the various combinations of ham and cheese (in pounds) that the nation of Bonovia could produce in a given month.  -Refer to Figure 3-11. For Bonovia, what is the opportunity cost of a pound of cheese?
(Multiple Choice)
4.8/5  (33)
(33)
Table 3-7
Assume that Japan and Korea can switch between producing cars and producing airplanes at a constant rate.  -Refer to Table 3-7. Korea should specialize in the production of
(Multiple Choice)
4.9/5 (35)
Table 3-5
Assume that England and Spain can switch between producing cheese and producing bread at a constant rate.  -Refer to Table 3-5. Without trade, England produced and consumed 32 units of cheese and 2 units of bread and Spain produced and consumed 6 units of cheese and 2 units of bread. Then, each country agreed to specialize in the production of the good in which it has a comparative advantage and trade 7 units of cheese for 2.5 units of bread. As a result, England gained
(Multiple Choice)
5.0/5 (40)
Table 3-13
The following table contains some production possibilities for an economy for a given month. SWratari Glavi 4 300 6 ? 8 100
-Refer to Table 3-13. If the production possibilities frontier is bowed outward, then "?" could be
(Multiple Choice)
4.7/5 (46)
Figure 3-9

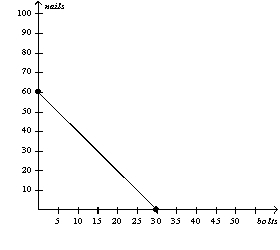
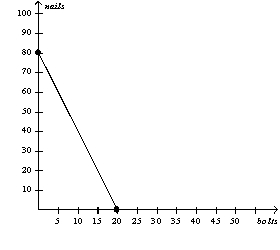 -Refer to Figure 3-9. Azerbaijan has an absolute advantage in the production of
(Multiple Choice)
4.9/5 (33)
Figure 3-8

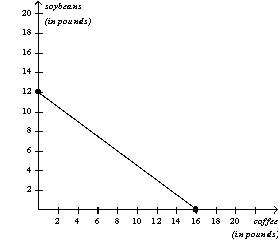
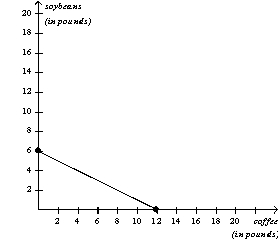 -Refer to Figure 3-8. Chile's opportunity cost of one pound of soybeans is
(Multiple Choice)
4.8/5 (40)
If one producer is able to produce a good at a lower opportunity cost than some other producer, then the producer with the lower opportunity cost is said to have an absolute advantage in the production of that good.
(True/False)
4.7/5 (36)
Figure 3-11
The graph below represents the various combinations of ham and cheese (in pounds) that the nation of Bonovia could produce in a given month. 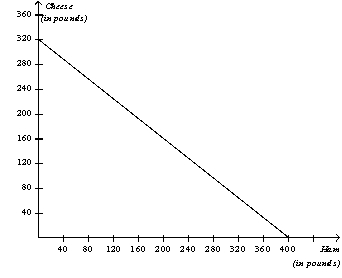 -Refer to Figure 3-11. If the production possibilities frontier shown is for 240 hours of production, then how long does it take Bonovia to make one pound of cheese?
(Multiple Choice)
4.7/5 (37)
The principle of comparative advantage does not provide answers to certain questions. One of those questions is
(Multiple Choice)
4.9/5 (28)
Table 3-9
Barb and Jim run a business that sets up and tests computers. Assume that Barb and Jim can switch between setting up and testing computers at a constant rate. The following table applies.  -Refer to Table 3-9. Barb's opportunity cost of setting up one computer is testing
(Multiple Choice)
4.8/5 (43)
Table 3-13
The following table contains some production possibilities for an economy for a given month. SWratari Glavi 4 300 6 ? 8 100
-Refer to Table 3-13. If the production possibilities frontier is a straight line, then "?" must be
(Multiple Choice)
4.8/5 (29)
Figure 3-8
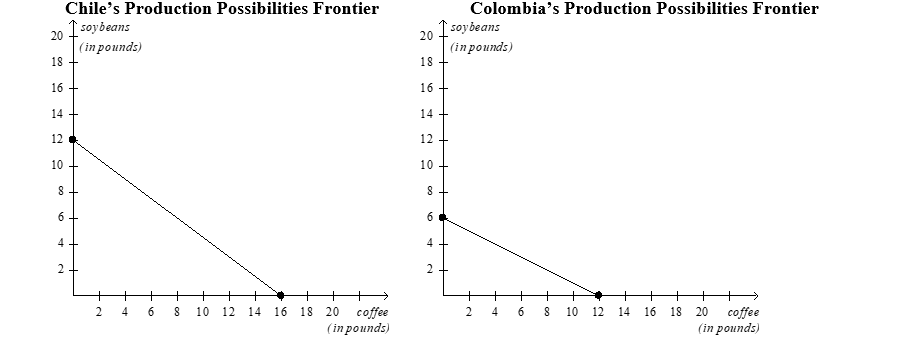 -Refer to Figure 3-8. If the production possibilities frontiers shown are each for one day of production, then which of the following combinations of coffee and soybeans could Chile and Colombia together make in a given day?
(Multiple Choice)
4.8/5 (32)
For a self-sufficient producer, the production possibilities frontier
(Multiple Choice)
4.7/5 (43)
A production possibilities frontier is a graph that shows the combination of outputs that an economy should produce.
(True/False)
4.9/5 (37)
An assumption of the production possibilities frontier model is that technology is fixed.
(True/False)
4.9/5 (38)
Figure 3-4

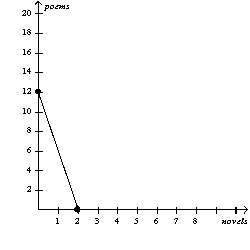
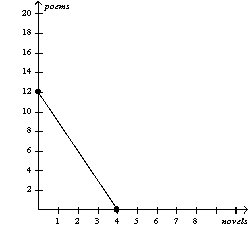 -Refer to Figure 3-4. Perry has a comparative advantage in the production of
(Multiple Choice)
4.7/5 (32)
Figure 3-4
-Refer to Figure 3-4. Jordan should specialize in the production of
(Multiple Choice)
5.0/5 (33)
Figure 3-9
-Refer to Figure 3-9. Azerbaijan's opportunity cost of one bolt is
(Multiple Choice)
4.8/5 (45)
Table 3-12
 -Refer to Table 3-12. Which of the following combinations of meat and potatoes could the rancher not produce in 40 hours?
(Multiple Choice)
4.9/5 (39)
Filters
- Essay(0)
- Multiple Choice(0)
- Short Answer(0)
- True False(0)
- Matching(0)