Exam 22: The Short-Run Trade-Off Between Inflation and Unemployment
Exam 1: Ten Principles of Economics347 Questions
Exam 2: Thinking Like an Economist535 Questions
Exam 3: Interdependence and the Gains From Trade442 Questions
Exam 4: The Market Forces of Supply and Demand569 Questions
Exam 5: Elasticity and Its Application503 Questions
Exam 6: Supply, Demand, and Government Policies556 Questions
Exam 7: Consumers, Producers, and the Efficiency of Markets460 Questions
Exam 8: Application: The Costs of Taxation422 Questions
Exam 9: Application: International Trade409 Questions
Exam 10: Measuring a Nations Income428 Questions
Exam 11: Measuring the Cost of Living436 Questions
Exam 12: Production and Growth417 Questions
Exam 13: Saving, Investment, and the Financial System473 Questions
Exam 14: The Basic Tools of Finance419 Questions
Exam 15: Unemployment571 Questions
Exam 16: The Monetary System423 Questions
Exam 17: Money Growth and Inflation388 Questions
Exam 18: Open-Economy Macroeconomic Models448 Questions
Exam 19: A Macroeconomic Theory of the Open Economy374 Questions
Exam 20: Aggregate Demand and Aggregate Supply471 Questions
Exam 21: The Influence of Monetary and Fiscal Policy on Aggregate Demand416 Questions
Exam 22: The Short-Run Trade-Off Between Inflation and Unemployment400 Questions
Exam 23: Six Debates Over Macroeconomic Policy235 Questions
Select questions type
In the 1970's the Federal Reserve responded to an adverse supply shock. Its policy made
(Multiple Choice)
4.9/5  (35)
(35)
Some countries have had relatively high inflation and relatively high unemployment for long periods of time. Is this consistent with the Phillips curve? Defend your answer.
(Essay)
4.8/5 (32)
Proponents of rational expectations argued that the sacrifice ratio
(Multiple Choice)
4.9/5 (45)
During the mid and last part of the 1990's both inflation and unemployment were low. In general this could have been the result of
(Multiple Choice)
4.9/5 (28)
The arguments of Friedman and Phelps would suggest that other things the same, a country that pursues a disinflationary policy that the public does not find completely credible
(Multiple Choice)
4.9/5 (36)
Other things the same, an increase in aggregate demand reduces unemployment and raises inflation in the short run.
(True/False)
4.8/5 (34)
Which of the following describes the Volcker disinflation most accurately?
(Multiple Choice)
4.7/5 (29)
Sticky wages leads to a positive relationship between the actual price level and the quantity of output supplied in
(Multiple Choice)
5.0/5 (42)
The consequences of the Volcker disinflation demonstrated that when Volcker announced his intention to reduce inflation quickly, on average the public thought
(Multiple Choice)
4.7/5 (30)
If the Federal Reserve decreases the rate at which it increases the money supply, then unemployment is higher in
(Multiple Choice)
4.8/5 (46)
A movement to the right along a given short-run Phillips curve could be caused by
(Multiple Choice)
4.9/5 (44)
Figure 22-3. The left-hand graph shows a short-run aggregate-supply (SRAS) curve and two aggregate-demand (AD) curves. On the left-hand diagram, Y represents output and on the right-hand diagram, U represents the unemployment rate. 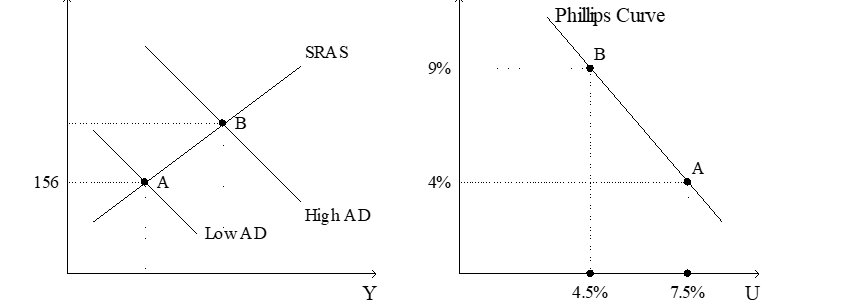 -Refer to Figure 22-3. What is measured along the vertical axis of the right-hand graph?
(Multiple Choice)
4.8/5 (31)
An event that directly affects firms' costs of production and thus the prices they charge is called
(Multiple Choice)
4.7/5 (46)
In response to the financial crisis of 2007-2008, policymakers used
(Multiple Choice)
4.8/5 (32)
Suppose that the Prime Minister and Parliament of Veridian are disappointed with the high inflation rates under the current system where the Veridian Ministry of Finance is in charge of the money supply. They make reforms to lower inflation from its current rate of 8%. Suppose further that the public is confident that with the reforms in place that inflation will fall to 2%. Also suppose that those in control of the money supply actually conduct monetary policy so that the actual inflation rate is 4%. Using long-run and short-run Phillips curves and assuming the natural rate of unemployment is 6%, show the initial long run equilibrium of Veridian and label it "A". Assuming that the government had actually set inflation at 2% and that the public believed this, label the long-run equilibrium "B". Now, suppose that inflation expectations fell to 2% and that the government unexpectedly created inflation of 4%. Show the short-run equilibrium and label it "C". If the money supply continues to grow at a rate consistent with 4% inflation, show where the economy ends up and label that point "D".
(Essay)
4.8/5 (45)
If the government reduced the minimum wage and pursued contractionary monetary policy, then in the long run
(Multiple Choice)
4.8/5 (46)
Assume the analysis of Friedman and Phelps is correct, so that the following equation is valid: Unemployment rate = Natural rate of unemployment - a * ctual inflation - x).In this equation,
(Multiple Choice)
4.8/5 (31)
Filters
- Essay(0)
- Multiple Choice(0)
- Short Answer(0)
- True False(0)
- Matching(0)