Exam 22: The Short-Run Trade-Off Between Inflation and Unemployment
Exam 1: Ten Principles of Economics347 Questions
Exam 2: Thinking Like an Economist535 Questions
Exam 3: Interdependence and the Gains From Trade442 Questions
Exam 4: The Market Forces of Supply and Demand569 Questions
Exam 5: Elasticity and Its Application503 Questions
Exam 6: Supply, Demand, and Government Policies556 Questions
Exam 7: Consumers, Producers, and the Efficiency of Markets460 Questions
Exam 8: Application: The Costs of Taxation422 Questions
Exam 9: Application: International Trade409 Questions
Exam 10: Measuring a Nations Income428 Questions
Exam 11: Measuring the Cost of Living436 Questions
Exam 12: Production and Growth417 Questions
Exam 13: Saving, Investment, and the Financial System473 Questions
Exam 14: The Basic Tools of Finance419 Questions
Exam 15: Unemployment571 Questions
Exam 16: The Monetary System423 Questions
Exam 17: Money Growth and Inflation388 Questions
Exam 18: Open-Economy Macroeconomic Models448 Questions
Exam 19: A Macroeconomic Theory of the Open Economy374 Questions
Exam 20: Aggregate Demand and Aggregate Supply471 Questions
Exam 21: The Influence of Monetary and Fiscal Policy on Aggregate Demand416 Questions
Exam 22: The Short-Run Trade-Off Between Inflation and Unemployment400 Questions
Exam 23: Six Debates Over Macroeconomic Policy235 Questions
Select questions type
Monetary Policy in Highland
Highland has had inflation of 15% for many years. Highland establishes a new central bank, the Bank of Highland, with the hopes of reducing the inflation rate.
-Refer to Monetary Policy in Highland. The Bank of Highland publicizes that it intends to reduce the inflation rate to 5%. If it is successful in doing so but people had expected inflation to fall only to 10%, then
(Multiple Choice)
4.9/5  (35)
(35)
Figure 22-8. The left-hand graph shows a short-run aggregate-supply (SRAS) curve and two aggregate-demand (AD) curves. On the right-hand diagram, "Inf Rate" means "Inflation Rate." 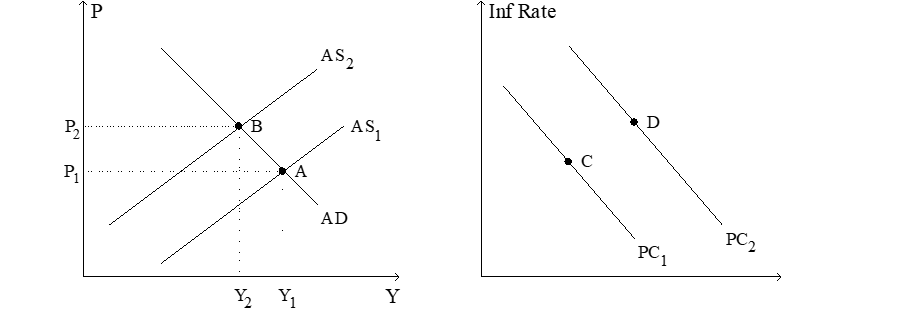 -Refer to Figure 22-8. The shift of the aggregate-supply curve from AS1 to AS2 could be a consequence of
(Multiple Choice)
4.9/5 (43)
Samuelson and Solow argued that a combination of low unemployment and low inflation
(Multiple Choice)
4.8/5 (37)
Figure 22-5
Use the graph below to answer the following questions. 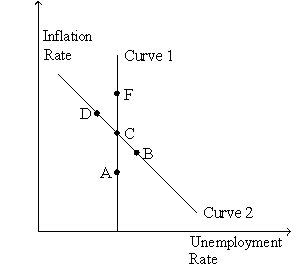 -Refer to Figure 22-5. The money supply growth rate is greatest at
(Multiple Choice)
4.9/5 (32)
If policymakers accommodate an adverse supply shock, then in the short run the unemployment rate
(Multiple Choice)
4.9/5 (48)
Figure 22-6
Use the two graphs in the diagram to answer the following questions.  -Refer to Figure 22-6. Starting from C and 3, in the long run, a decrease in money supply growth moves the economy to
(Multiple Choice)
4.9/5 (31)
Proponents of rational expectations argue that failing to account for peoples' revised inflation expectations led to estimates of the sacrifice ratio that were too high.
(True/False)
4.9/5 (43)
By raising aggregate demand more than anticipated, policymakers
(Multiple Choice)
4.8/5 (40)
If the long-run Phillips curve shifts to the left, then for any given rate of money growth and inflation the economy has
(Multiple Choice)
4.9/5 (39)
If the minimum wage increased, then at any given rate of inflation
(Multiple Choice)
4.9/5 (31)
Figure 22-8. The left-hand graph shows a short-run aggregate-supply (SRAS) curve and two aggregate-demand (AD) curves. On the right-hand diagram, "Inf Rate" means "Inflation Rate."
-Refer to Figure 22-8. Which of the following events could explain the shift of the aggregate-supply curve from AS1 to AS2?
(Multiple Choice)
4.8/5 (31)
If the sacrifice ratio is 2, reducing the inflation rate from 10 percent to 6 percent would require sacrificing
(Multiple Choice)
4.8/5 (38)
If the short-run Phillips curve were stable, which of the following would be unusual?
(Multiple Choice)
4.8/5 (42)
Figure 22-5
Use the graph below to answer the following questions.
-Refer to Figure 22-5. If the economy starts at C and the money supply growth rate decreases, in the short run the economy moves to
(Multiple Choice)
4.9/5 (32)
A central bank announces it will decrease the inflation rate by 10 percentage points. People are skeptical of the announcement, but do expect the central bank will reduce inflation by 5 percentage points and so expected inflation falls by 5 percentage points. If the central bank decreases inflation by only 3 percentage points then the unemployment rate will fall.
(True/False)
4.9/5 (34)
As the aggregate demand curve shifts leftward along a given aggregate supply curve,
(Multiple Choice)
4.8/5 (39)
Filters
- Essay(0)
- Multiple Choice(0)
- Short Answer(0)
- True False(0)
- Matching(0)