Exam 22: The Short-Run Trade-Off Between Inflation and Unemployment
Exam 1: Ten Principles of Economics347 Questions
Exam 2: Thinking Like an Economist535 Questions
Exam 3: Interdependence and the Gains From Trade442 Questions
Exam 4: The Market Forces of Supply and Demand569 Questions
Exam 5: Elasticity and Its Application503 Questions
Exam 6: Supply, Demand, and Government Policies556 Questions
Exam 7: Consumers, Producers, and the Efficiency of Markets460 Questions
Exam 8: Application: The Costs of Taxation422 Questions
Exam 9: Application: International Trade409 Questions
Exam 10: Measuring a Nations Income428 Questions
Exam 11: Measuring the Cost of Living436 Questions
Exam 12: Production and Growth417 Questions
Exam 13: Saving, Investment, and the Financial System473 Questions
Exam 14: The Basic Tools of Finance419 Questions
Exam 15: Unemployment571 Questions
Exam 16: The Monetary System423 Questions
Exam 17: Money Growth and Inflation388 Questions
Exam 18: Open-Economy Macroeconomic Models448 Questions
Exam 19: A Macroeconomic Theory of the Open Economy374 Questions
Exam 20: Aggregate Demand and Aggregate Supply471 Questions
Exam 21: The Influence of Monetary and Fiscal Policy on Aggregate Demand416 Questions
Exam 22: The Short-Run Trade-Off Between Inflation and Unemployment400 Questions
Exam 23: Six Debates Over Macroeconomic Policy235 Questions
Select questions type
In the long run, a decrease in the money supply growth rate
(Multiple Choice)
4.8/5  (28)
(28)
Figure 22-2
Use the pair of diagrams below to answer the following questions.  -Refer to Figure 22-2. If the economy starts at C and 1, then in the short run, an increase in government expenditures moves the economy to
(Multiple Choice)
4.9/5 (36)
The restrictive monetary policy followed by the Fed in the early 1980s
(Multiple Choice)
4.9/5 (48)
According to the long-run Phillips curve, in the long run monetary policy influences
(Multiple Choice)
4.8/5 (35)
Prime Minister Emma Bigshot urges passage of a bill to reduce unemployment benefits from very generous levels in her country. She also urges her country's central bank to raise the rate at which the money supply is increasing. In the long run which, if either, of these policies will reduce the unemployment rate?
(Multiple Choice)
4.8/5 (43)
Figure 22-8. The left-hand graph shows a short-run aggregate-supply (SRAS) curve and two aggregate-demand (AD) curves. On the right-hand diagram, "Inf Rate" means "Inflation Rate." 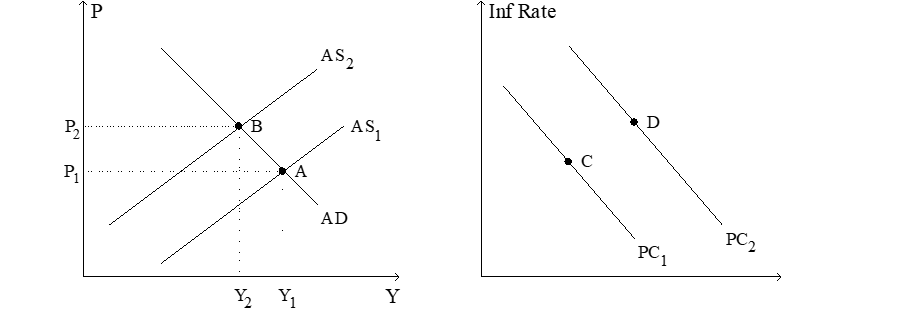 -Refer to Figure 22-8. What is measured along the horizontal axis of the right-hand graph?
(Multiple Choice)
4.8/5 (40)
Figure 22-6
Use the two graphs in the diagram to answer the following questions.  -Refer to Figure 22-6. The economy would move from C to B
(Multiple Choice)
4.9/5 (37)
The short-run relationship between inflation and unemployment is often called
(Multiple Choice)
4.8/5 (35)
If policymakers decrease aggregate demand, then in the short run the price level
(Multiple Choice)
4.8/5 (47)
Suppose that the central bank unexpectedly increases the growth rate of the money supply. In the short run the effects of this are shown by
(Multiple Choice)
4.8/5 (30)
Natural rate of unemployment - a * ctual inflation - Expected inflation) =
(Multiple Choice)
4.8/5 (38)
If inflation expectations rise, the short-run Phillips curve shifts
(Multiple Choice)
4.8/5 (29)
The Economy in 2008
In the first half of June 2008 the effects of a housing and financial crisis and an increase in world prices of oil and foodstuffs were affecting the economy.
-Refer to The Economy in 2008. The short-run effects of rising world commodity prices are shown by
(Multiple Choice)
4.9/5 (38)
In the long run people come to expect whatever inflation rate the Fed chooses to produce, so unemployment returns to its natural rate.
(True/False)
4.9/5 (35)
In the long run, if there is an increase in the money supply growth rate, which of the following curves shifts right?
(Multiple Choice)
5.0/5 (33)
Figure 22-1. The left-hand graph shows a short-run aggregate-supply (SRAS) curve and two aggregate-demand (AD) curves. On the right-hand diagram, U represents the unemployment rate.  -Refer to Figure 22-1. The curve that is depicted on the right-hand graph offers policymakers a "menu" of combinations
(Multiple Choice)
4.9/5 (37)
According to classical macroeconomic theory, in the long run
(Multiple Choice)
4.9/5 (33)
Filters
- Essay(0)
- Multiple Choice(0)
- Short Answer(0)
- True False(0)
- Matching(0)