Exam 2: Trade-Offs, Comparative Advantage, and the Market System
Exam 1: Economics: Foundations and Models148 Questions
Exam 2: Trade-Offs, Comparative Advantage, and the Market System314 Questions
Exam 3: Where Prices Come From: The Interaction of Supply and Demand314 Questions
Exam 4: GDP: Measuring Total Production and Income277 Questions
Exam 5: Unemployment and Inflation300 Questions
Exam 6: Economic Growth, The Financial System, and Business Cycles262 Questions
Exam 7: Long-Run Economic Growth: Sources and Policies280 Questions
Exam 8: Aggregate Expenditure and Output in the Short Run315 Questions
Exam 9: Aggregate Demand and Aggregate Supply Analysis246 Questions
Exam 10: Money, Banks, and the Bank of Canada285 Questions
Exam 11: Monetary Policy281 Questions
Exam 12: Fiscal Policy303 Questions
Exam 13: Inflation, Unemployment, and Bank of Canada Policy265 Questions
Exam 14: Macroeconomics in an Open Economy280 Questions
Exam 15: The International Financial System228 Questions
Select questions type
Figure 2.2 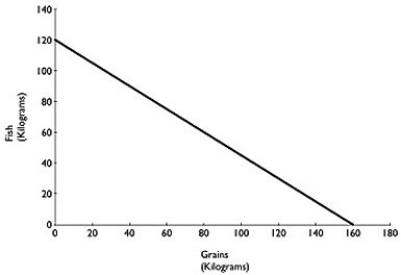 Figure 2.2 above shows the production possibilities frontier for Atikamekw Cree (ca.1600)with a historical tradition of fishing and farming.Assume they produce two goods: fish and grains.
Alt text for Figure 2.2: In figure 2.2, a graph compares production of grains and fish.
Long description for Figure 2.2: The x-axis is labelled, grains in kilograms, and the y-axis is labelled, fish in kilograms.The x-axis is marked from 0 to 180, in increments of 20.The y-axis is marked from 0 to 140, in increments of 20.A line slopes down from the point 0, 120 to the point 160, 0.
-Refer to Figure 2.2.What is the opportunity cost of one kilogram of Fish?
Figure 2.2 above shows the production possibilities frontier for Atikamekw Cree (ca.1600)with a historical tradition of fishing and farming.Assume they produce two goods: fish and grains.
Alt text for Figure 2.2: In figure 2.2, a graph compares production of grains and fish.
Long description for Figure 2.2: The x-axis is labelled, grains in kilograms, and the y-axis is labelled, fish in kilograms.The x-axis is marked from 0 to 180, in increments of 20.The y-axis is marked from 0 to 140, in increments of 20.A line slopes down from the point 0, 120 to the point 160, 0.
-Refer to Figure 2.2.What is the opportunity cost of one kilogram of Fish?
(Multiple Choice)
4.7/5  (40)
(40)
Figure 2.17 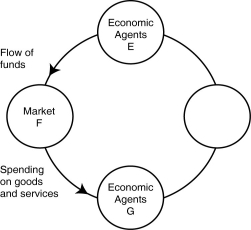 Alt text for Figure 2.17: In figure 2.17, a circular flow diagram.
Long description for Figure 2.17: 4 circles arranged in a circle, labelled as follows, clockwise from the top center: Economic Agents E, an unmarked circle, Market F, and Economic Agents G.The flow of funds goes from Economic Agents E to Market F.Another arrow shows the flow of spending on goods and services from Market F to Economic Agents G.
-Refer to Figure 2.17.One segment of the circular flow diagram in the figure shows the flow of funds from economic agents E to market F.Who are economic agents E and what is market F?
Alt text for Figure 2.17: In figure 2.17, a circular flow diagram.
Long description for Figure 2.17: 4 circles arranged in a circle, labelled as follows, clockwise from the top center: Economic Agents E, an unmarked circle, Market F, and Economic Agents G.The flow of funds goes from Economic Agents E to Market F.Another arrow shows the flow of spending on goods and services from Market F to Economic Agents G.
-Refer to Figure 2.17.One segment of the circular flow diagram in the figure shows the flow of funds from economic agents E to market F.Who are economic agents E and what is market F?
(Multiple Choice)
4.8/5 (31)
Figure 2.1  Alt text for Figure 2.1: In figure 2.1, a graph compares roadsters and S U Vs.
Long description for Figure 2.1: The x-axis is labelled, S U Vs, and the y-axis is labelled, roadsters.3 points A, B, and C are plotted on the graph.A concave curve is drawn between the y-axis and the x-axis, from near the top of the y-axis, to near the end of the y-axis.Near the mid-point of the curve, it passes through point B.Point A is between the curve and the origin, and point C is outside the curve, midway along the x-axis and near the top of the y-axis.
-Refer to Figure 2.1.Point A is
Alt text for Figure 2.1: In figure 2.1, a graph compares roadsters and S U Vs.
Long description for Figure 2.1: The x-axis is labelled, S U Vs, and the y-axis is labelled, roadsters.3 points A, B, and C are plotted on the graph.A concave curve is drawn between the y-axis and the x-axis, from near the top of the y-axis, to near the end of the y-axis.Near the mid-point of the curve, it passes through point B.Point A is between the curve and the origin, and point C is outside the curve, midway along the x-axis and near the top of the y-axis.
-Refer to Figure 2.1.Point A is
(Multiple Choice)
4.8/5 (41)
The production possibilities frontier model assumes all of the following, except
(Multiple Choice)
4.9/5 (44)
If Blake can pick more cherries in one hour than Cody, then Blake has a comparative advantage in cherry picking.
(True/False)
4.9/5 (34)
Suppose there is no unemployment in the economy and society decides that it wants more of one good.Which of the following statements is true?
(Multiple Choice)
4.8/5 (31)
Figure 2.13  Figure 2.13 shows the production possibilities frontiers for Pakistan and Indonesia.Each country produces two goods, cotton and cashews.
Alt text for Figure 2.13: In figure 2.13, 2 graphs, show the production possibilities frontiers for Pakistan and Indonesia.
Long description for Figure 2.13: The graph on the left represents Pakistan.The x-axis is labelled, cotton in bolts, and the amount 240 marked.The y-axis is labelled, cashews in pounds, and the amount 150 is marked .A slanted line is drawn from point 150 on the y-axis to point 240 on the x-axis.The graph on the right represents Indonesia.The x-axis is labelled, cotton, in bolts, and the amount 320 is marked.The y-axis is labelled, cashews, in pounds, and the amount 120 marked.A slanted line is drawn from point 120 on the y-axis to point 320 on the x-axis.
-Refer to Figure 2.13.Which country has a comparative advantage in the production of cotton?
Figure 2.13 shows the production possibilities frontiers for Pakistan and Indonesia.Each country produces two goods, cotton and cashews.
Alt text for Figure 2.13: In figure 2.13, 2 graphs, show the production possibilities frontiers for Pakistan and Indonesia.
Long description for Figure 2.13: The graph on the left represents Pakistan.The x-axis is labelled, cotton in bolts, and the amount 240 marked.The y-axis is labelled, cashews in pounds, and the amount 150 is marked .A slanted line is drawn from point 150 on the y-axis to point 240 on the x-axis.The graph on the right represents Indonesia.The x-axis is labelled, cotton, in bolts, and the amount 320 is marked.The y-axis is labelled, cashews, in pounds, and the amount 120 marked.A slanted line is drawn from point 120 on the y-axis to point 320 on the x-axis.
-Refer to Figure 2.13.Which country has a comparative advantage in the production of cotton?
(Multiple Choice)
4.8/5 (39)
In a two-good, two-country world, if one country has an absolute advantage in the production of both goods, it can still benefit by trading with the other country.
(True/False)
4.7/5 (30)
The payment received by suppliers of entrepreneurial skills is called interest.
(True/False)
4.9/5 (34)
Table 2.6  Table 2.6 shows the number of labour hours required to produce a digital camera and a pound of wheat in China and South Korea.
-Refer to Table 2.6.If the two countries specialize and trade, who should export digital cameras?
Table 2.6 shows the number of labour hours required to produce a digital camera and a pound of wheat in China and South Korea.
-Refer to Table 2.6.If the two countries specialize and trade, who should export digital cameras?
(Multiple Choice)
4.9/5 (40)
Suppose there is some unemployment in the economy and society decides that it wants more of one good.Which of the following statements is true?
(Multiple Choice)
4.7/5 (36)
To compete in the automobile market, Toyota must make many strategic decisions, such as whether to introduce a new car model, whether to produce alternative-fuel vehicles, and where to advertise.At Toyota's Cambridge, Ontario plant, managers must decide on the monthly production quantities of their Corolla, Matrix, Rav4, and Lexus RX 450h models.In making these decisions, the managers
(Multiple Choice)
4.8/5 (36)
Figure 2.2 Figure 2.2 above shows the production possibilities frontier for Atikamekw Cree (ca.1600)with a historical tradition of fishing and farming.Assume they produce two goods: fish and grains.
Alt text for Figure 2.2: In figure 2.2, a graph compares production of grains and fish.
Long description for Figure 2.2: The x-axis is labelled, grains in kilograms, and the y-axis is labelled, fish in kilograms.The x-axis is marked from 0 to 180, in increments of 20.The y-axis is marked from 0 to 140, in increments of 20.A line slopes down from the point 0, 120 to the point 160, 0.
-Refer to Figure 2.2.What is the opportunity cost of one kilogram of grain?
(Multiple Choice)
4.8/5 (29)
Figure 2.8 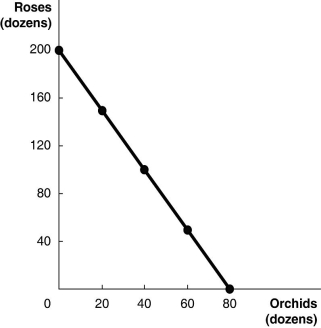 Figure 2.8 above shows the production possibilities frontier for Vidalia, a nation that produces two goods, roses and orchids.
Alt text for Figure 2.8: In figure 2.8, a graph illustrates the production possibilities frontier for roses and orchids in Vidalia.
Long description for Figure 2.8: The x-axis is labelled, orchids, in dozens, and is marked from 0 to 80 in increments of 20.The y-axis is labelled, roses, in dozens, and is marked from 0 to 200 in increments of 40.Five points (0, 200), (20, 150), (40, 100), (60, 50), and (80, 0)are plotted on the graph and joined to form a line, which slants from the top left corner and slopes down to the bottom right corner.
-Refer to Figure 2.8.Suppose Vidalia is currently producing 20 dozen orchids per period.How many roses is it also producing, assuming that resources are fully utilized?
Figure 2.8 above shows the production possibilities frontier for Vidalia, a nation that produces two goods, roses and orchids.
Alt text for Figure 2.8: In figure 2.8, a graph illustrates the production possibilities frontier for roses and orchids in Vidalia.
Long description for Figure 2.8: The x-axis is labelled, orchids, in dozens, and is marked from 0 to 80 in increments of 20.The y-axis is labelled, roses, in dozens, and is marked from 0 to 200 in increments of 40.Five points (0, 200), (20, 150), (40, 100), (60, 50), and (80, 0)are plotted on the graph and joined to form a line, which slants from the top left corner and slopes down to the bottom right corner.
-Refer to Figure 2.8.Suppose Vidalia is currently producing 20 dozen orchids per period.How many roses is it also producing, assuming that resources are fully utilized?
(Multiple Choice)
4.8/5 (36)
Figure 2.6 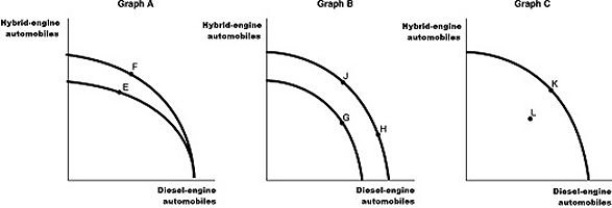 Toyota found the emission standards too difficult to meet to bring its diesel-engine offerings to North America.They have instead focused their research on hybrid-engine technology.Assume Toyota chooses to produce both hybrid-engine vehicles and diesel-engine vehicles (for markets outside North America)for its Prius brand.Figure 2.6 shows changes to its production possibilities frontier in response to new developments and different strategic production decisions.
Alt text for Figure 2.6: In figure 2.6, 3 graphs, A, B and C show the changes to Toyota's production possibilities frontier.
Long description for Figure 2.6: Graph A: The x-axis is labelled, diesel-engine automobiles, and the y-axis is labelled, hybrid-engine automobiles.2 convex curves are shown.The first curve begins slightly above the half-way point of the y-axis and ends near the end of the x-axis.The curve passes through point E about 1 third of the way along the curve.The second curve begins slightly above the first, on the y-axis.It finishes at the exact same point on the x-axis.The second curve passes through point F about 1 third of the way along the curve.Graph B: The x-axis is labelled, diesel-engine automobiles, and the y-axis is labelled hybrid-engine automobiles.2 convex curves are shown.The first curve begins slightly above the half-way mark on the y-axis and finishes about 2 thirds of the way along the x-axis.The curve passes through the point G, about halfway along the curve.The second curve begins slightly above the first on the y-axis, and finishes just past the end of the first on the x-axis.The curve passes through point J about 1 third of the way along the curve, and point H about 3 fourths of the way along the curve.Graph C: The x-axis is labelled, diesel-engine automobiles, and the y-axis is labelled hybrid-engine automobiles.A convex curve begins near the top of the y-axis and finishes near the end of the x-axis.It passes through point K about half-way along the curve.Point L is plotted between the curve and the axes.
-Refer to Figure 2.6.In response to changing regulations and enforcement, Toyota has cut back on the production of diesel-powered vehicles and increased its hybrid production.This strategy is best represented by the
Toyota found the emission standards too difficult to meet to bring its diesel-engine offerings to North America.They have instead focused their research on hybrid-engine technology.Assume Toyota chooses to produce both hybrid-engine vehicles and diesel-engine vehicles (for markets outside North America)for its Prius brand.Figure 2.6 shows changes to its production possibilities frontier in response to new developments and different strategic production decisions.
Alt text for Figure 2.6: In figure 2.6, 3 graphs, A, B and C show the changes to Toyota's production possibilities frontier.
Long description for Figure 2.6: Graph A: The x-axis is labelled, diesel-engine automobiles, and the y-axis is labelled, hybrid-engine automobiles.2 convex curves are shown.The first curve begins slightly above the half-way point of the y-axis and ends near the end of the x-axis.The curve passes through point E about 1 third of the way along the curve.The second curve begins slightly above the first, on the y-axis.It finishes at the exact same point on the x-axis.The second curve passes through point F about 1 third of the way along the curve.Graph B: The x-axis is labelled, diesel-engine automobiles, and the y-axis is labelled hybrid-engine automobiles.2 convex curves are shown.The first curve begins slightly above the half-way mark on the y-axis and finishes about 2 thirds of the way along the x-axis.The curve passes through the point G, about halfway along the curve.The second curve begins slightly above the first on the y-axis, and finishes just past the end of the first on the x-axis.The curve passes through point J about 1 third of the way along the curve, and point H about 3 fourths of the way along the curve.Graph C: The x-axis is labelled, diesel-engine automobiles, and the y-axis is labelled hybrid-engine automobiles.A convex curve begins near the top of the y-axis and finishes near the end of the x-axis.It passes through point K about half-way along the curve.Point L is plotted between the curve and the axes.
-Refer to Figure 2.6.In response to changing regulations and enforcement, Toyota has cut back on the production of diesel-powered vehicles and increased its hybrid production.This strategy is best represented by the
(Multiple Choice)
4.9/5 (32)
Figure 2.7 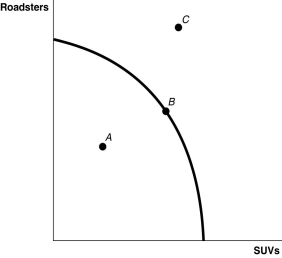 Alt text for Figure 2.7: In figure 2.7, a graph compares production possibility frontiers of S U Vs and Roadsters.
Long description for Figure 2.7: The x-axis is labelled, S U Vs, and the y-axis is labelled, Roadsters.A convex curve begins near the top of the y-axis and ends approximately 3 quarters of the way down the x-axis.The point B is plotted midway along the curve.Point A is plotted between the curve and the y-axis.Point C is plotted outside the curve, near the top of the y-axis and approximately midway along the x-axis.
-Refer to Figure 2.7. ________ is (are)technically efficient.
Alt text for Figure 2.7: In figure 2.7, a graph compares production possibility frontiers of S U Vs and Roadsters.
Long description for Figure 2.7: The x-axis is labelled, S U Vs, and the y-axis is labelled, Roadsters.A convex curve begins near the top of the y-axis and ends approximately 3 quarters of the way down the x-axis.The point B is plotted midway along the curve.Point A is plotted between the curve and the y-axis.Point C is plotted outside the curve, near the top of the y-axis and approximately midway along the x-axis.
-Refer to Figure 2.7. ________ is (are)technically efficient.
(Multiple Choice)
4.7/5 (29)
Table 2.1
Production choices for Tomaso's Trattoria  -Refer to Table 2.1.Assume Tomaso's Trattoria only produces pizzas and calzones.A combination of 24 pizzas and 30 calzones would appear
(Multiple Choice)
4.8/5 (37)
Crystal Schick is a highly talented photographer.She has chosen to specialize in photography because of all of the following except
(Multiple Choice)
4.7/5 (37)
________ a nation's production possibilities frontier represents economic growth.
(Multiple Choice)
4.8/5 (41)
Table 2.13  -Refer to Table 2.13.This table shows the number of labour hours required to produce a cell phone and a cubic metre of lumber in Estonia and Finland.
a. Which country has an absolute advantage in the production of cell phones?
b. Which country has an absolute advantage in the production of lumber?
c. What is Estonia's opportunity cost of producing one cell phone?
d. What is Finland's opportunity cost of producing one cell phone?
e. What is Estonia's opportunity cost of producing one cubic metre of lumber?
f. What is Finland's opportunity cost of producing one cubic metre of lumber?
g. If each country specializes in the production of the product in which it has a comparative advantage, who should produce cell phones?
h. If each country specializes in the production of the product in which it has a comparative advantage, who should produce lumber?
-Refer to Table 2.13.This table shows the number of labour hours required to produce a cell phone and a cubic metre of lumber in Estonia and Finland.
a. Which country has an absolute advantage in the production of cell phones?
b. Which country has an absolute advantage in the production of lumber?
c. What is Estonia's opportunity cost of producing one cell phone?
d. What is Finland's opportunity cost of producing one cell phone?
e. What is Estonia's opportunity cost of producing one cubic metre of lumber?
f. What is Finland's opportunity cost of producing one cubic metre of lumber?
g. If each country specializes in the production of the product in which it has a comparative advantage, who should produce cell phones?
h. If each country specializes in the production of the product in which it has a comparative advantage, who should produce lumber?
(Essay)
4.7/5 (38)
Filters
- Essay(0)
- Multiple Choice(0)
- Short Answer(0)
- True False(0)
- Matching(0)