Exam 18: Introduction to Quality and Statistical Process Control
Exam 1: The Where,Why,and How of Data Collection167 Questions
Exam 2: Graphs,Charts and Tablesdescribing Your Data139 Questions
Exam 3: Describing Data Using Numerical Measures138 Questions
Exam 4: Introduction to Probability125 Questions
Exam 5: Discrete Probability Distributions161 Questions
Exam 6: Introduction to Continuous Probability Distributions122 Questions
Exam 7: Introduction to Sampling Distributions136 Questions
Exam 8: Estimating Single Population Parameters174 Questions
Exam 9: Introduction to Hypothesis Testing183 Questions
Exam 10: Estimation and Hypothesis Testing for Two Population Parameters121 Questions
Exam 11: Hypothesis Tests and Estimation for Population Variances69 Questions
Exam 12: Analysis of Variance162 Questions
Exam 13: Goodness-Of-Fit Tests and Contingency Analysis105 Questions
Exam 14: Introduction to Linear Regression and Correlation Analysis139 Questions
Exam 15: Multiple Regression Analysis and Model Building152 Questions
Exam 16: Analyzing and Forecasting Time-Series Data133 Questions
Exam 17: Introduction to Nonparametric Statistics103 Questions
Exam 18: Introduction to Quality and Statistical Process Control43 Questions
Select questions type
Referring to the SPC chart signals that a process is out of control,what type of problem does each signal indicate? List the signals.
(Essay)
4.8/5  (29)
(29)
Common cause variation is variation in the output of a process that is unexpected and has an assignable cause.
(True/False)
4.8/5 (44)
Special cause variation is variation in the output of a process that is naturally occurring and expected and that may be the result of random causes.
(True/False)
4.7/5 (35)
The statistical process control (SPC)chart is one of the most important tools for identifying important issues to improve quality.
(True/False)
4.9/5 (35)
The control limits in a control chart can be interpreted to mean:
(Multiple Choice)
4.9/5 (40)
The six most common sources of variation are people,machines,materials,methods,measurement,and environment.
(True/False)
4.9/5 (33)
A company that fills soft drinks into bottles wishes to establish an  -chart to monitor the average fill level in the bottles.To do this,the company has taken a series of samples of size n = 4 bottles.The overall average fill is 12.03 ounces.The average range for the subgroups has been .06 ounces.Based on this information,what is the upper limit of the 3-sigma control limit?
(Multiple Choice)
4.8/5 (33)
In process improvement efforts,the goal is to first remove the common cause variation and then to reduce the special cause variation in a system.
(True/False)
4.8/5 (40)
Each evening,a nationwide retail chain randomly calls 100 of the customers who came to their store that day to ask whether they were satisfied with the service they had received.The customers respond yes or no.Suppose the company has found over time that 8 percent of the customers are not satisfied ("no" answers),what is the 3-sigma upper and lower control limits for the appropriate control chart?
(Multiple Choice)
4.9/5 (35)
One of the most common sources of common cause variation is the people who are working in the process.
(True/False)
4.9/5 (33)
A tire company is interested in monitoring the process that produced tread thickness on its tires.Every hour 4 tires are selected from production and the tread thickness is measured.Data for the past 25 days is shown as follows: 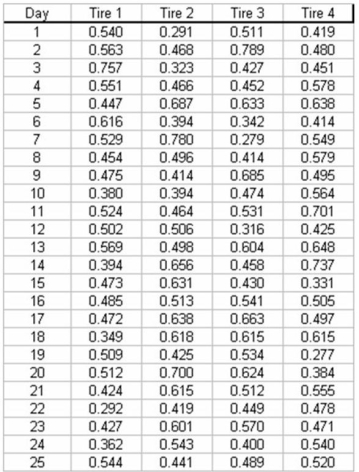 a.What type of control chart would you recommend be used in this case?
b.Compute the upper and lower control limits for these data.
a.What type of control chart would you recommend be used in this case?
b.Compute the upper and lower control limits for these data.
(Essay)
4.9/5 (30)
A major airline is interested in monitoring customer satisfaction with its baggage handling process.To do so,each day the airline randomly selects 100 customers and surveys them to determine if they are satisfied or not with the service provided.After 20 samples,a total of 260 unsatisfied customers were surveyed.
a.If the airline wishes to use a control chart,which chart would you recommend and why?
b.Determine the 3-sigma control limits for the appropriate control chart.
(Essay)
4.7/5 (34)
Recently a shipping company took 30 samples,each of size n = 100,of packages that it was responsible for delivering.Out of the 3,000 total packages,300 were delivered late.In setting up an appropriate process control chart,what would be the correct 3-sigma upper control limit value?
(Multiple Choice)
4.9/5 (28)
A stable process is typically defined as one in which all output is operating within ± 3 standard deviations of the process center.
(True/False)
4.9/5 (23)
Process control charts are used to provide signals to indicate when the output of a process is out of control.
(True/False)
4.9/5 (30)
A process control chart can be used to determine whether the process average has shifted up or down,but is not useful for determining whether the process is just drifting in an upward or downward direction.
(True/False)
4.9/5 (32)
Which of the following in not an out of control signal for an x-bar chart?
(Multiple Choice)
4.9/5 (36)
Both p-charts and c-charts are designed for use when the data we are working with are referred to as attribute data.
(True/False)
4.9/5 (43)
Filters
- Essay(0)
- Multiple Choice(0)
- Short Answer(0)
- True False(0)
- Matching(0)