Exam 15: Multiple Regression Analysis and Model Building
The following regression output is the result of a multiple regression application in which we are interested in explaining the variation in retail price of personal computers based on three independent variables,CPU speed,RAM,hard drive capacity,and-monitor included (1=Yes,0=No). 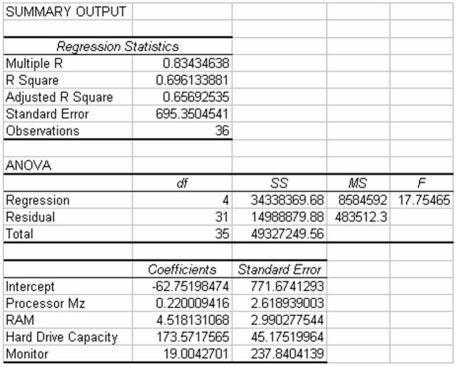 Given this output,what is the variable,Monitor,called? Also,given the other variables in the model,is Monitor significant in explaining the variation in the dependent variable? Test using a .05 level of alpha.
The variable Monitor included is a qualitative variable since the actual value for this variable is either yes or no depending on whether the listed price includes a monitor or not.In order to include this variable,only one dummy is needed and it has been coded 1 = yes and 0 = no.Given this,the regression result shows that the coefficient for the dummy variable,Monitor,is 19.004.To test this we establish the following null and alternative hypotheses and test statistic:
H0 : B1 = 0.0
Ha : B1 ≠ 0.0
The test statistic is:
t = 
= 
= .0799
We compare this value to the table t value for 0.05 level of statistical significance and n-k-1 = 31 degrees of freedom.The critical value from the table is 2.0395.Since 0.0799 < 2.0395,we do not reject the null hypothesis.Thus,in the presence of the other variables,knowing whether the computer has a monitor included or not is of no statistical significance in explaining the variation in the dependent variable.
If a decision maker has several potential independent variables to select from in building a regression model,the variable that,by itself,will always be the most effective in explaining the variation in the dependent variable will be the variable that has a correlation closest to positive 1.00.
False
If one independent variable affects the relationship between a second independent variable and the dependent variable,it is said that there is interaction between the two independent variables.
True
Under what circumstances does the variance inflation factor signal that multicollinearity may be a problem?
Which of the following is not considered to be a stepwise regression technique?
In a multiple regression model,the adjusted R-square value measures the explained variation in the dependent variable after taking into account the relationship between the sample size and the number of independent variables in the model.
When the best subsets approach is used in a regression application,one method for determining which of the many possible models to select for potential use is called the Cp statistic.
A multiple regression model of the form  = B0 + B1x + B2x2 + B3x3 + ε is called an expanded second-order polynomial since it contains all the terms up to x3 in the model at one time.
The following residual plot was constructed based on a simple linear regression model. 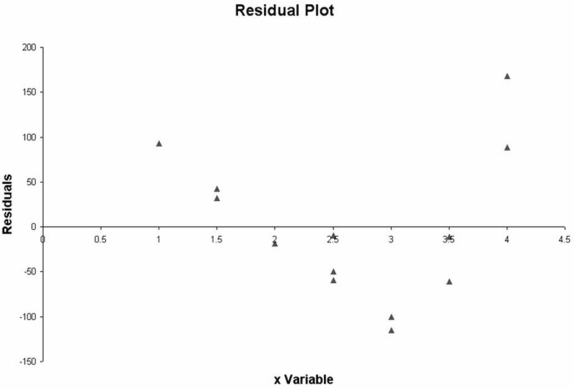 Based on this plot,there appears to be no basis for concluding that a curvilinear model may be more appropriate than a linear model to explain the variation in the y variable.
If a polynomial model has a larger R-square than a linear model for the same set of data,this is one indication that the polynomial model fits the data better than the linear model.
In a forward selection stepwise regression process,the second variable to be selected from the list of potential independent variables is always the one that has the second highest correlation with the dependent variable.
A multiple regression is shown for a data set of yachts where the dependent variable is the price in thousands of dollars. 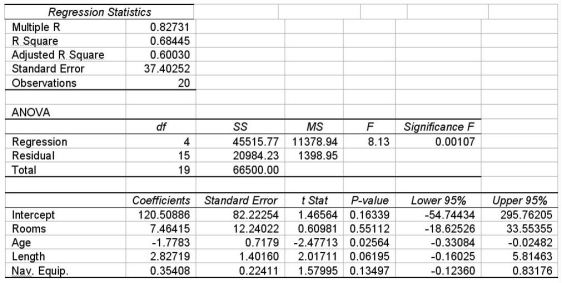 Given this information,which is correct regarding the test of the overall model using the 0.10 level of significance?
The following output is for a second-order polynomial regression model where the independent variables are x and x2 (x^2 in output).Some of the output has been omitted. 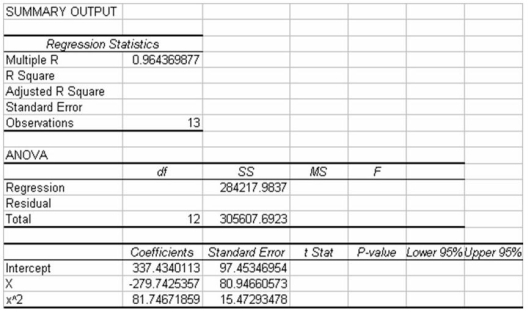 Considering the above information,the model explains approximately 56.7 percent of the variation in the y variable.
Standard stepwise regression is a good way of identifying potential multicollinearity problems since we are able to see the impact on the model at each step that occurs when a new variable is added to the model.For instance,if bringing in a new variable causes the sign to change on a previously entered variable,we have evidence of multicollinearity.
The editors of a national automotive magazine recently studied 30 different automobiles sold in the United States with the intent of seeing whether they could develop a multiple regression model to explain the variation in highway miles per gallon.A number of different independent variables were collected.The following regression output (with some values missing)was recently presented to the editors by the magazine's analysts: 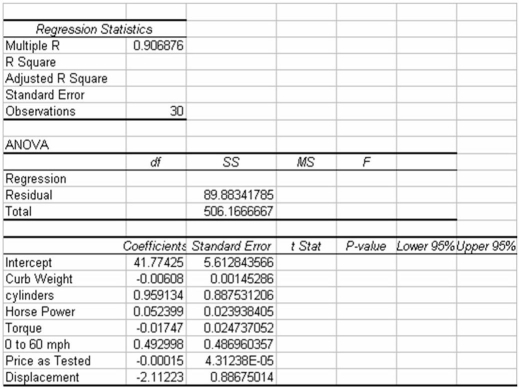 Based on this output and your understanding of multiple regression analysis,what is the adjusted R-square value for this model?
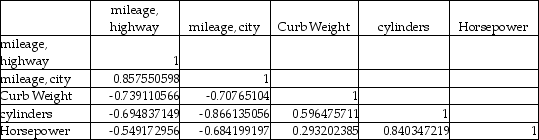
A major car magazine has recently collected data on 30 leading cars in the U.S.market.It is interested in building a multiple regression model to explain the variation in highway miles.The following correlation matrix has been computed from the data collected:
 The analysts also produced the following multiple regression output using curb weight,cylinders,and horsepower as the three independent variables.Note,a number of the output fields are missing,but can be determined from the information provided.
 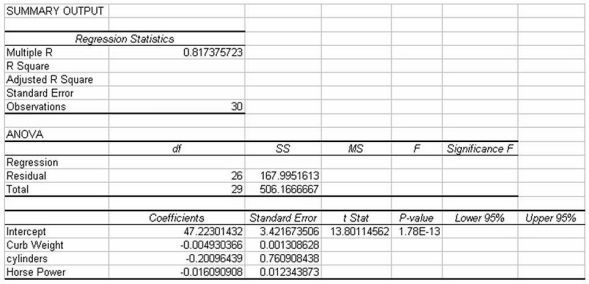 Based on this information,the standard error of the estimate for the regression model is approximately 6.46 miles per gallon.
The following regression output is the result of a multiple regression application in which we are interested in explaining the variation in retail price of personal computers based on three independent variables,CPU speed,RAM,and hard drive capacity.However,some of the regression output has been omitted. 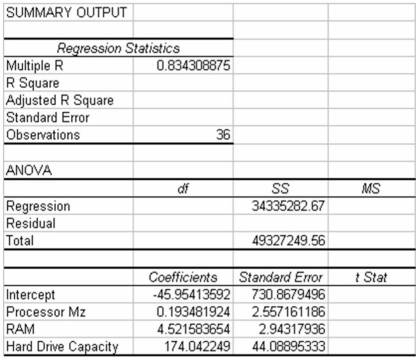 Given this information and your knowledge of multiple regression,what percentage of variation in the dependent variable is explained by the three independent variables in the model?
Interaction terms and polynomial terms should not be included in the same multiple regression model.
A regression equation that predicts the price of homes in thousands of dollars is  = 24.6 + 0.055x1 - 3.6x2,where x2 is a dummy variable that represents whether the house is on a busy street or not.Here
x2 = 1 means the house is on a busy street and x2 = 0 means it is not.From this we can conclude that on average homes that are on busy streets are worth $3600 more than homes that are not on busy streets.
= 24.6 + 0.055x1 - 3.6x2,where x2 is a dummy variable that represents whether the house is on a busy street or not.Here
x2 = 1 means the house is on a busy street and x2 = 0 means it is not.From this we can conclude that on average homes that are on busy streets are worth $3600 more than homes that are not on busy streets.
Filters
- Essay(0)
- Multiple Choice(0)
- Short Answer(0)
- True False(0)
- Matching(0)