Exam 14: Introduction to Linear Regression and Correlation Analysis
Exam 1: The Where,Why,and How of Data Collection167 Questions
Exam 2: Graphs,Charts and Tablesdescribing Your Data139 Questions
Exam 3: Describing Data Using Numerical Measures138 Questions
Exam 4: Introduction to Probability125 Questions
Exam 5: Discrete Probability Distributions161 Questions
Exam 6: Introduction to Continuous Probability Distributions122 Questions
Exam 7: Introduction to Sampling Distributions136 Questions
Exam 8: Estimating Single Population Parameters174 Questions
Exam 9: Introduction to Hypothesis Testing183 Questions
Exam 10: Estimation and Hypothesis Testing for Two Population Parameters121 Questions
Exam 11: Hypothesis Tests and Estimation for Population Variances69 Questions
Exam 12: Analysis of Variance162 Questions
Exam 13: Goodness-Of-Fit Tests and Contingency Analysis105 Questions
Exam 14: Introduction to Linear Regression and Correlation Analysis139 Questions
Exam 15: Multiple Regression Analysis and Model Building152 Questions
Exam 16: Analyzing and Forecasting Time-Series Data133 Questions
Exam 17: Introduction to Nonparametric Statistics103 Questions
Exam 18: Introduction to Quality and Statistical Process Control43 Questions
Select questions type
The fact that teachers' salaries in Wisconsin are correlated with egg prices in Texas means that the two variables are spuriously correlated since a change in one variable could not cause the change in the other.
Free
(True/False)
4.9/5  (33)
(33)
Correct Answer: Verified
True
A research study has stated that the taxes paid by individuals is correlated at a .78 value with the age of the individual.Given this,the scatter plot would show points that would fall on straight line on a slope equal to .78.
Free
(True/False)
5.0/5 (36)
Correct Answer:Verified
False
Residual analysis is conducted to check whether regression assumptions are met.Which of the following is not an assumption made in simple linear regression?
Free
(Multiple Choice)
4.7/5 (39)
Correct Answer:Verified
C
A manufacturing company is interested in predicting the number of defects that will be produced each hour on the assembly line.The managers believe that there is a relationship between the defect rate and the production rate per hour.The managers believe that they can use production rate to predict the number of defects.The following data were collected for 10 randomly selected hours.
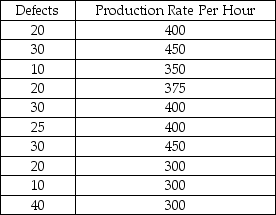 Given these sample data,the simple linear regression model for predicting the number of defects is approximately
  = 5.67 + 0.048x.
(True/False)
4.9/5 (32)
In analyzing the residuals to determine whether the simple regression analysis satisfies the regression assumptions,which of the following is true?
(Multiple Choice)
4.8/5 (30)
A correlation of -0.9 indicates a weak linear relationship between the variables.
(True/False)
4.9/5 (33)
A recent study by a major financial investment company was interested in determining whether the annual percentage change in stock price for companies is linearly related to the annual percent change in profits for the company.The following data was determined for 7 randomly selected companies: 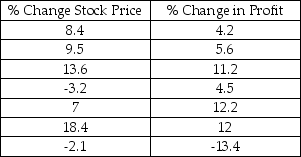 Based upon this sample information,what portion of variation in stock price percentage change is explained by the percent change in yearly profit?
(Multiple Choice)
4.7/5 (27)
The following regression model has been computed based on a sample of twenty observations:  = 34.2 + 19.3x.Given this model,the predicted value for y when x = 40 is 806.2.
(True/False)
4.9/5 (32)
The following regression output is available.Notice that some of the values are missing. 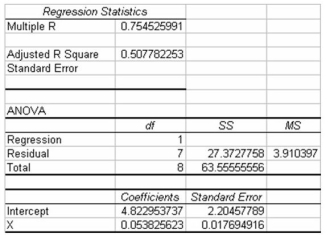 Given this information,what percent of the variation in the y variable is explained by the independent variable?
(Multiple Choice)
4.8/5 (32)
In conducting a hypothesis test for a correlation,the correct probability distribution to use is the F distribution.
(True/False)
4.8/5 (38)
A regression analysis between sales (Y)and advertising (X)(both in dollars)resulted in the following equation:  = 100 + 2000X The above equation implies that an
(Multiple Choice)
4.7/5 (28)
A study was recently done in which the following regression output was generated using Excel.
SUMMARY OUTPUT 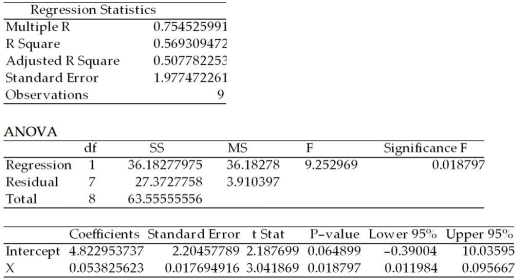 Given this,we know that approximately 57 percent of the variation in the y variable is explained by the x variable.
(True/False)
4.8/5 (36)
A bank is interested in determining whether its customers' checking balances are linearly related to their savings balances.A sample of n = 20 customers was selected and the correlation was calculated to be +0.40.If the bank is interested in testing to see whether there is a significant linear relationship between the two variables using a significance level of 0.05,the value of the test statistic is approximately t = 1.8516.
(True/False)
4.7/5 (25)
A bank is interested in determining whether its customers' checking balances are linearly related to their savings balances.A sample of n = 20 customers was selected and the correlation was calculated to be +0.40.If the bank is interested in testing to see whether there is a significant linear relationship between the two variables using a significance level of .05,the correct null and alternative hypotheses to test are:
H0 : r = 0.0
Ha : r ≠ 0.0
(True/False)
4.9/5 (36)
Use the following regression results to answer the question below. 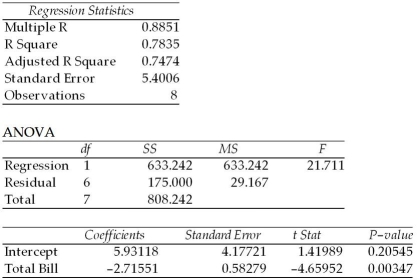 In conducting a hypothesis test of the slope using a 0.05 level of significance,which of the following is correct?
(Multiple Choice)
4.8/5 (40)
The following data for the dependent variable,y,and the independent variable,x,have been collected using simple random sampling: 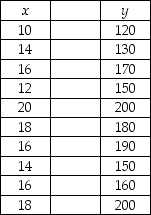 Compute the correlation coefficient.
(Multiple Choice)
4.8/5 (36)
If it is known that a simple linear regression model explains 56 percent of the variation in the dependent variable and that the slope on the regression equation is negative,then we also know that the correlation between x and y is approximately -0.75.
(True/False)
4.9/5 (37)
The sum of the residuals in a least squares regression model will be zero only when the correlation between the x and y variables is statistically significant.
(True/False)
4.8/5 (36)
In a study of 30 customers' utility bills in which the monthly bill was the dependent variable and the number of square feet in the house is the independent variable,the resulting regression model is  = 23.40 + 0.4x.Given this,the sample correlation coefficient is known to be positive.
(True/False)
4.8/5 (38)
If two variables are uncorrelated,the sample correlation coefficient will be r = 0.00.
(True/False)
4.8/5 (37)
Filters
- Essay(0)
- Multiple Choice(0)
- Short Answer(0)
- True False(0)
- Matching(0)