Exam 3: Describing Data Using Numerical Measures
Exam 1: The Where,Why,and How of Data Collection167 Questions
Exam 2: Graphs,Charts and Tablesdescribing Your Data139 Questions
Exam 3: Describing Data Using Numerical Measures138 Questions
Exam 4: Introduction to Probability125 Questions
Exam 5: Discrete Probability Distributions161 Questions
Exam 6: Introduction to Continuous Probability Distributions122 Questions
Exam 7: Introduction to Sampling Distributions136 Questions
Exam 8: Estimating Single Population Parameters174 Questions
Exam 9: Introduction to Hypothesis Testing183 Questions
Exam 10: Estimation and Hypothesis Testing for Two Population Parameters121 Questions
Exam 11: Hypothesis Tests and Estimation for Population Variances69 Questions
Exam 12: Analysis of Variance162 Questions
Exam 13: Goodness-Of-Fit Tests and Contingency Analysis105 Questions
Exam 14: Introduction to Linear Regression and Correlation Analysis139 Questions
Exam 15: Multiple Regression Analysis and Model Building152 Questions
Exam 16: Analyzing and Forecasting Time-Series Data133 Questions
Exam 17: Introduction to Nonparametric Statistics103 Questions
Exam 18: Introduction to Quality and Statistical Process Control43 Questions
Select questions type
The interquartile range contains the middle 50 percent of a data set.
Free
(True/False)
4.8/5  (32)
(32)
Correct Answer: Verified
True
A professor wishes to develop a numerical method for giving grades.He intends to base the grade on homework,two midterms,a project,and a final examination.He wishes the final exam to have the largest influence on the grade.He wants the project to have 10%,each midterm to have 20%,and the homework to have 10% of the influence of the semester grade. Determine the weights the professor should use to produce a weighted average for grading purposes.
Free
(Multiple Choice)
4.8/5 (39)
Correct Answer:Verified
A
Which of the following statements is true?
Free
(Multiple Choice)
4.9/5 (38)
Correct Answer:Verified
C
Which of the following measures is not affected by extreme values in the data?
(Multiple Choice)
4.8/5 (29)
If a set of data has 1,500 values,the 30th percentile value will correspond to the 450th value in the data when the data have been arranged in numerical order.
(True/False)
4.7/5 (32)
Suppose a study of houses that have sold recently in your community showed the following frequency distribution for the number of bedrooms:
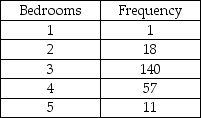 Based on this information the mean number of bedrooms in houses that sold is approximately 3.26.
(True/False)
4.8/5 (36)
You are given the following data:
 If these data were considered to be a population and you computed the mean,you would get the same answer as if these data were considered to be a sample from a larger population.
(True/False)
4.8/5 (27)
At a sawmill in Oregon,a process improvement team measured the diameters for a sample of 1,500 logs.The following summary statistics were computed:  Given this information,which of the following statements is correct?
(Multiple Choice)
4.8/5 (24)
The range is an ideal measure of variation since it is not sensitive to extreme values in the data.
(True/False)
4.9/5 (34)
The advantage of using the interquartile range versus the range as a measure of variation is:
(Multiple Choice)
4.8/5 (34)
Consumer products are required by law to contain at least as much as the amount printed on the package.For example a bag of potato chips that is labeled as 10 ounces should contain at least 10 ounces.Assume that the standard deviation of the packaging equipment yields a bag weight standard deviation of 0.2 ounces.Explain what average bag weight must be used to achieve at least 97.5 percent of the bags having 10 or more ounces in the bag.Assume the bag weight distribution is bell-shaped.
(Essay)
5.0/5 (38)
The second quartile for a set of data will have the same value as the 50th percentile only when the data are symmetric.
(True/False)
4.8/5 (31)
When surveyed,a sample of 1,250 patients at a regional hospital provided interviewers with the following summary statistics pertaining to the hospital charges:
Minimum = $278.00 Q1 = $1,245 Q2 = $3,567 Q3= $4,702.
Based on these data,if you were to construct a box and whisker plot,the value $278 would be considered an outlier.
(True/False)
4.8/5 (43)
A sample of people who have attended a college football game at your university has a mean = 3.2 members in their family.The mode number of family members is 2 and the median number is 2.0.Based on this information:
(Multiple Choice)
4.8/5 (27)
A large retail company gives an employment screening test to all prospective employees.If a prospective employee receives a report saying that she scored at the 40th percentile:
(Multiple Choice)
4.9/5 (33)
Based on the empirical rule we can assume that all bell-shaped distributions have approximately 95 percent of the values within ± 2 standard deviations of the mean.
(True/False)
4.9/5 (28)
The Good-Guys Car Dealership has tracked the number of used cars sold at its downtown dealership.Consider the following data as representing the population of cars sold in each of the 8 weeks that the dealership has been open.
 The population variance is approximately 9.43.
(True/False)
4.8/5 (33)
The following data reflect the number of customers who test drove new cars each day for a sample of 20 days at the Redfield Ford Dealership. 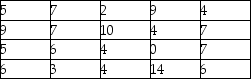 Given these data,what is the interquartile range?
(Multiple Choice)
4.7/5 (40)
Data was collected on the number of television sets in a household,and it was found that the mean was 3.5 and the standard deviation was 0.75. Based on these sample data,what is the standardized value corresponding to 5 televisions?
(Multiple Choice)
4.9/5 (40)
The Good-Guys Car Dealership has tracked the number of used cars sold at its downtown dealership.Consider the following data as representing the population of cars sold in each of the 8 weeks that the dealership has been open.
 The population range is 9.
(True/False)
4.8/5 (30)
Filters
- Essay(0)
- Multiple Choice(0)
- Short Answer(0)
- True False(0)
- Matching(0)