Exam 10: Estimation and Hypothesis Testing for Two Population Parameters
A major U.S.oil company has developed two blends of gasoline.Managers are interested in estimating the difference in mean gasoline mileage that will be obtained from using the two blends.As part of their study,they have decided to run a test using the Chevrolet Impala automobile with automatic transmissions.They selected a random sample of 100 Impalas using Blend 1 and another 100 Impalas using Blend 2.Each car was first emptied of all the gasoline in its tank and then filled with the designated blend of the new gasoline.The car was then driven 200 miles on a specified route involving both city and highway roads.The cars were then filled and the actual miles per gallon were recorded.The following summary data were recorded:
Blend 1 Blend 2
Sample Size 100 100
Sample Mean 23.4 mpg 25.7 mpg
Sample St.Dev.4.0 mpg 4.2 mpg
Based on these sample data,compute and interpret the 95 percent confidence interval estimate for the difference in mean mpg for the two blends.
The general format for a confidence interval estimate is:
Point estimate ± critical value (standard error).
In this case,the point estimate is 
1 - 
2 = 23.4 - 25.7 = -2.3 mpg.
This value forms the center of the interval estimate.To complete the confidence interval,we need to compute the standard error.Since the sample sizes in this example are large,we compute the standard error using:
sc = 
= 
= 0.58
The critical value for a 95 percent confidence interval based on large samples is z = 1.96 from the standard normal table.Therefore,the 95 percent confidence interval estimate for the difference in population means is: 
1 - 
2 ± z 
.Substituting we get
(23.4 - 25.7)± 1.96 
which gives -2.3 ± 1.96(.58)or -2.3 ± 1.1368.
Thus we get: -3.4368 mpg to -1.1632 mpg.
We interpret this to mean that based on the sample information,with 95 percent confidence,Impalas using Blend 1 will get between 1.1632 and 3.4368 mpg less than Impalas using Blend 2.
A major retail clothing store is interested in estimating the difference in mean monthly purchases by customers who use the store's in-house credit card versus using a Visa,Mastercard,or one of the other major credit cards.To do this,it has randomly selected a sample of customers who have made one or more purchases with each of the types of credit cards.The following represents the results of the sampling:  Based on these sample data,what is the lower limit for the 95 percent confidence interval estimate for the difference between population means?
C
An advertising company has developed a new ad for one of the national car manufacturing companies.The ad agency is interested in testing whether the proportion of favorable responses to the ad is the same between male adults versus female adults.It plans on conducting the test using an alpha level equal to 0.05.A sample of 100 adults of each gender will be used in the study.Each person will be asked to view the ad and indicate whether they find the ad to be "pleasing" or not.Given this,what is the appropriate null hypothesis?
D
An advertising company has developed a new ad for one of the national car manufacturing companies.The ad agency is interested in testing whether the proportion of favorable response to the ad is the same between male adults versus female adults.It plans on conducting the test using an alpha level equal to 0.05.A sample of 100 adults of each gender will be used in the study.Each person will be asked to view the ad and indicate whether they find the ad to be "pleasing" or not.Given this information,what is the critical value?
A recent study posed the question about whether Japanese managers are more motivated than American managers.A randomly selected sample of each was administered the Sarnoff Survey of Attitudes Toward Life (SSATL),which measures motivation for upward mobility.The SSATL scores are summarized below. 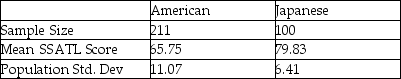 Which of the following is the correct the null and alternative hypotheses to determine if the average SSATL score of Japanese managers differs from the average SSATL score of American managers?
If you are interested in estimating the difference between the means of two samples that have been paired,the point estimate for this difference is the mean value of the paired differences.
A credit card company operates two customer service centers: one in Boise and one in Richmond.Callers to the service centers dial a single number,and a computer program routs callers to the center having the fewest calls waiting.As part of a customer service review program,the credit card center would like to determine whether the average length of a call (not including hold time)is different between the two centers.The managers of the customer service centers are willing to assume that the populations of interest are normally distributed with equal variances.Suppose a random sample of phone calls to the two centers is selected and the following results are reported: 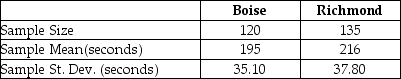 Using the sample results,develop a 90% confidence interval estimate for the difference between the two population means.
All other things held constant,increasing the level of confidence for a confidence interval estimate for the difference between two population means will result in a wider confidence interval estimate.
In order to test the difference in populations means,samples were collected for two independent populations where the variances are assumed equal and the population normally distributed.The following data resulted:
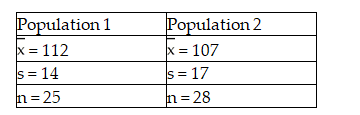 The value of the pooled standard deviation is 15.66.
A major retail clothing store is interested in estimating the difference in mean monthly purchases by customers who use the store's in-house credit card versus using a Visa,Mastercard,or one of the other major credit cards.To do this,it has randomly selected a sample of customers who have made one or more purchases with each of the types of credit cards.The following represents the results of the sampling: 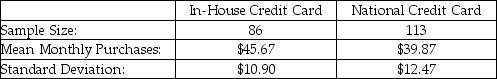 Given this information,which of the following statements is true?
The NCAA is interested in estimating the difference in mean number of daily training hours for men and women athletes on college campuses.They want 95 percent confidence and will select a sample of 10 men and 10 women for the study.If the NCAA assumes that the population standard deviations are known,the critical value for the confidence interval is t = 2.1009.
If the sample data lead us to suspect that the variances of the two populations are not equal,the t-test statistic and the degrees of freedom must be adjusted accordingly.
The American College Health Association produced the National College Health Assessment (Andy Gardiner,"Surfacing from Depression," February 6,2006).The assessment indicates that the percentage of U.S.college students who report having been diagnosed with depression has risen from 2000.The assessment surveyed 47,202 students at 74 campuses.It discovered that 10.3% and 14.9% of students indicated that they had been diagnosed with depression in 2000 and 2004,respectively.Assume that half of the students surveyed were surveyed in 2004. Indicate the margin of error for estimating p1 - p2 with  1 -
1 -  2.
2.
A commuter has two different routes available to drive to work.She wants to test whether route A is faster than route B.The best hypotheses are:
Suppose that two population proportions are being compared to test whether there is any difference between them.Assume that the test statistic has been calculated to be z = 2.21.Find the p-value for this situation.
There are a number of highly touted search engines for finding things of interest on the Internet.Recently a consumer rating system ranked two search engines ahead of the others.Now,a computer user's magazine wishes to make the final determination regarding which one is actually better at finding particular information.To do this,each search engine was used in an attempt to locate specific information using specified keywords.Both search engines were subjected to 100 queries.Search engine 1 successfully located the information 88 times and search engine 2 located the information 80 times.Using a significance level equal to 0.05,what is the null hypothesis to be tested?
Under what conditions can the t-distribution be correctly employed to test the difference between two population means?
The following samples are observations taken from the same elements at two different times: 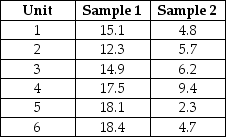 Perform a test of hypothesis to determine if the difference in the means of the distribution at the first time period is 10 units larger than at the second time period.Use a level of significance equal to 0.10.
You are given the following results of a paired-difference test:  = -4.6 sd = 0.25
N = 16
Construct a 90% confidence interval estimate for the paired difference in mean values.
= -4.6 sd = 0.25
N = 16
Construct a 90% confidence interval estimate for the paired difference in mean values.
The NCAA is interested in estimating the difference in mean number of daily training hours for men and women athletes on college campuses.It wants 95 percent confidence and will select a sample of 10 men and 10 women for the study.The variances are assumed equal and the populations normally distributed.The sample results are:
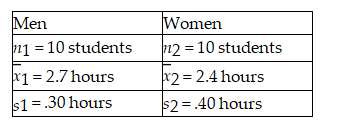 Based on these sample data,the critical value for developing the confidence interval is z = 1.96.
Filters
- Essay(0)
- Multiple Choice(0)
- Short Answer(0)
- True False(0)
- Matching(0)