Exam 16: Analyzing and Forecasting Time-Series Data
Exam 1: The Where,Why,and How of Data Collection167 Questions
Exam 2: Graphs,Charts and Tablesdescribing Your Data139 Questions
Exam 3: Describing Data Using Numerical Measures138 Questions
Exam 4: Introduction to Probability125 Questions
Exam 5: Discrete Probability Distributions161 Questions
Exam 6: Introduction to Continuous Probability Distributions122 Questions
Exam 7: Introduction to Sampling Distributions136 Questions
Exam 8: Estimating Single Population Parameters174 Questions
Exam 9: Introduction to Hypothesis Testing183 Questions
Exam 10: Estimation and Hypothesis Testing for Two Population Parameters121 Questions
Exam 11: Hypothesis Tests and Estimation for Population Variances69 Questions
Exam 12: Analysis of Variance162 Questions
Exam 13: Goodness-Of-Fit Tests and Contingency Analysis105 Questions
Exam 14: Introduction to Linear Regression and Correlation Analysis139 Questions
Exam 15: Multiple Regression Analysis and Model Building152 Questions
Exam 16: Analyzing and Forecasting Time-Series Data133 Questions
Exam 17: Introduction to Nonparametric Statistics103 Questions
Exam 18: Introduction to Quality and Statistical Process Control43 Questions
Select questions type
In a recent meeting,the marketing manager for a large hardware company stated that he needed to have a forecast prepared for the next three months.The three-month period is called:
Free
(Multiple Choice)
4.8/5  (34)
(34)
Correct Answer: Verified
A
It is possible to use linear regression analysis to develop a forecasting model for nonlinear data if we can effectively transform the data.
Free
(True/False)
4.8/5 (36)
Correct Answer:Verified
True
Which of the following time-series components can be identified when a company has 12 weeks of data beginning January and extending through March?
Free
(Multiple Choice)
4.9/5 (40)
Correct Answer:Verified
D
The Morgan Company is interested in developing a forecast for next month's sales.It has collected sales data for the past 12 months.
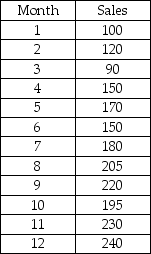 Assuming that the company plans to use double exponential smoothing with starting values for the smoothed constant process value and smoothed trend value of 98.97 and 13.16 respectively,the MAD value for periods 2-12 is greater when alpha = 0.20 and beta = 0.20 than when alpha = 0.10 and beta = 0.10.
(True/False)
4.8/5 (40)
In order to identify a cyclical component in time-series data,one year of weekly data should be sufficient.
(True/False)
4.9/5 (36)
A company has a monthly time series that regularly shows sales being higher in the summer months.This is an example of which component?
(Multiple Choice)
4.8/5 (30)
In a single exponential smoothing model,one smoothing constant is used to weigh the historical data,and the model is of primary value when the data do not exhibit trend or seasonal components.
(True/False)
4.8/5 (37)
The Wilson Company is interested in forecasting demand for its XG-667 product for quarter 13 based on 12 quarters of data.The following shows the data and the double exponential smoothing model results for periods 1-12 using alpha = 0.20 and beta = 0.40. 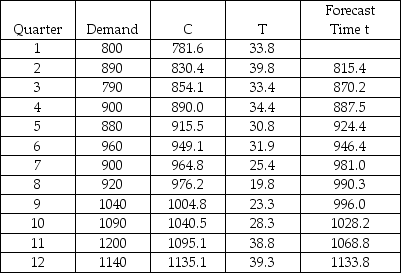 Based on this information,which of the following statements is true?
(Multiple Choice)
4.8/5 (27)
A time-series graph shows that annual sales data have grown gradually over the past 10 years.Given this,if a linear trend model is used to forecast future years' sales,the sign on the regression slope coefficient will be positive.
(True/False)
4.9/5 (39)
The Zocor Company is interested in forecasting period 13 sales for a product.It has 12 months of historical data.The following shows the data and the forecasted valued for periods 1-12 using a single exponential smoothing model with a smoothing constant value equal to 0.20 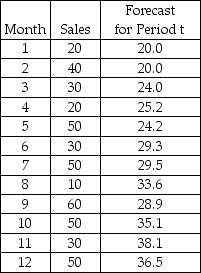 What is the value of the MAD for periods 2-12?
(Multiple Choice)
4.8/5 (34)
Which of the following statements about the Durbin-Watson d statistic is true?
(Multiple Choice)
4.8/5 (25)
From an annual time series of a company's sales the linear trend model Ft = 127 + 54(t)has been developed.This means that on average sales have been increasing by 127 per year.
(True/False)
4.8/5 (33)
A company has recorded the 12 months of sales data for the past year.It wishes to use the regression approach to develop a trend-based approach for forecasting future months.The following data are provided: 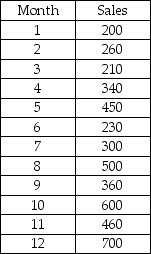 Based on this information,which of the following is forecast for month 15?
(Multiple Choice)
4.8/5 (41)
The Boxer Company has been in business since 1998.The following sales data are recorded by quarter for the years 2010-2012. 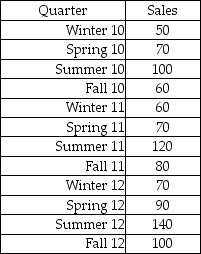 The managers at the company wish to determine the seasonal indexes for each quarter during the year.The first step in the process is to remove the seasonal and random components.To do this,they will begin by computing a four-period moving average.They then compute the centered moving average.What is the centered moving average for Spring '01?
(Multiple Choice)
4.8/5 (37)
If a manager is planning for an expansion of the factory,a forecast model with a long-term planning horizon would probably be used.•
(True/False)
4.8/5 (33)
Suppose an economist has developed a model for forecasting annual consumption,yt,as function of total labor income,x1t ,and total property income,x2t based on 20 years on annual data.The following regression model has been developed:  t = 7.81 + 0.91x1t + 0.57x2t with the standard error = 1.29 and the Durbin-Watson d statistic = 2.09.Using an alpha = .05,which of the following conclusions should be reached?
(Multiple Choice)
4.8/5 (28)
Harrison Hollow,an upscale eatery in Atlanta,tracks its sales on a daily basis.Recently,the manager stated that sales over the past three weeks have been very cyclical.Given the data she has,this statement is not a reasonable one to make.
(True/False)
4.9/5 (34)
When using the multiplicative time-series model to determine the seasonal indexes,the first step is to isolate the seasonal and random components from the cyclical and trend components.
(True/False)
4.8/5 (37)
If the forecast errors are autocorrelated,this is a good indication that the model has been specified correctly.
(True/False)
4.8/5 (39)
Suppose an economist has developed a model for forecasting annual consumption,yt,as function of total labor income,x1t,and total property income,x2t based on 20 years on annual data.The following regression model has been developed:  t= 7.81 + 0.91x1t + 0.57x2t with the standard error = 1.29 and the Durbin-Watson d statistic = 2.09.Using an alpha = .05,which of the following is the correct critical value for testing whether the residuals are autocorrelated?
(Multiple Choice)
4.9/5 (39)
Filters
- Essay(0)
- Multiple Choice(0)
- Short Answer(0)
- True False(0)
- Matching(0)