Exam 9: Quality Control and Improvement
Exam 1: The Operations Function41 Questions
Exam 2: Operations and Supply Chain Strategy48 Questions
Exam 3: Product Design44 Questions
Exam 4: Process Selection52 Questions
Exam 5: Service Delivery System Design53 Questions
Exam 6: Process-Flow Analysis44 Questions
Exam 7: Lean Thinking and Lean Systems52 Questions
Exam 8: Managing Quality50 Questions
Exam 9: Quality Control and Improvement50 Questions
Exam 10: Forecasting54 Questions
Exam 11: Capacity Planning50 Questions
Exam 12: Scheduling Operations42 Questions
Exam 13: Project Planning and Scheduling39 Questions
Exam 14: Independent Demand Inventory60 Questions
Exam 15: Materials Requirements Planning and ERP44 Questions
Exam 16: Supply Chain Management47 Questions
Exam 17: Sourcing45 Questions
Exam 18: Global Logistics42 Questions
Select questions type
Put the following statements in the correct order: (1)Decide who should do the inspection.
(2)Decide on the type of measurement.
(3)Decide on the amount of inspection.
(4)Decide on the critical points requiring inspection.
(Multiple Choice)
5.0/5  (43)
(43)
Which statement best represents the key assumption(s)of process control?
(Multiple Choice)
4.9/5 (35)
Which of the following quality control sample statistics indicates a quality characteristic that is an attribute?
(Multiple Choice)
5.0/5 (44)
Consider the following statements: (1)The primary focus of lean is to reduce waste.
(2)The primary focus of six sigma is to reduce defects.
(Multiple Choice)
4.8/5 (34)
The seven tools of quality control are equally applicable to both manufacturing and service industries.
(True/False)
4.9/5 (33)
The work of 20 claims processors is sampled and examined for errors.100 claims are randomly pulled for each processor with the results shown below.What is the upper limit of the control chart?
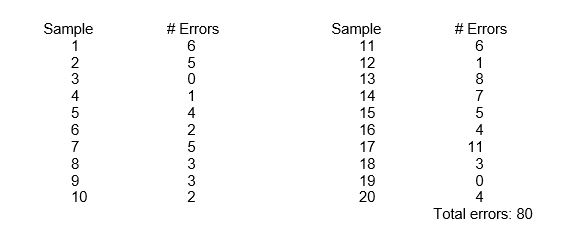
(Multiple Choice)
4.7/5 (47)
Of the four choices below,which is the earliest step in designing a quality control system?
(Multiple Choice)
4.8/5 (36)
A production process delivers an unexpectedly large amount of scrap products.Top management has discovered that improper machine maintenance is the reason behind this failure.The above statement is an example of a special cause of variation.
(True/False)
4.8/5 (37)
Suppose that a process is in a state of control and we have the following information for a human weights measurement study: Average weight of males in the study = 150 lbs.
Average range of the male weights = 100 lbs.
A2 = .577
D3 = 0
D4 = 2.115
What is the upper control limit for the average (mean)chart?
(Multiple Choice)
4.8/5 (31)
The seven tools of quality control include all of the following EXCEPT
(Multiple Choice)
4.8/5 (37)
Which of the following is/are assumption(s)of process control?
(Multiple Choice)
4.9/5 (29)
A manufacturer of television wall mounts would like to make a chart to monitor the percentage of defective mounting brackets due to problems with drilled holes.These holes may be defective because they are off-center,out of round,or not drilled.Five samples,each of size 100,have been taken from the production process and the discrepancies are as follows: 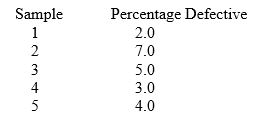 Using this information and a 3 standard deviation chart,the upper control limit is
(Multiple Choice)
4.9/5 (30)
Which of the following is a critical inspection point where inspection and testing of products occur in a quality control system?
(Multiple Choice)
4.9/5 (41)
One of the first stages in any statistical process control program is to ascertain that the equipment utilized for an operation is inherently capable of producing within the design tolerance.For a particular lathe operation,run under controlled conditions so that no assignable causes of variation have been introduced,the outside diameter of each sampled part was measured,and the operator found that the standard deviation was 0.0075 centimeters (cm).What is the process capability if the upper specification limit is 7.508 cm and the lower specification limit is 7.388 cm?
(Multiple Choice)
4.9/5 (34)
Using the same data as in Question 10,what is the lower control limit for a p-chart?
(Multiple Choice)
4.8/5 (37)
If the population of items produced does not meet or exceed the upper and low specification limits (all items produced are well within specification limits),the process capability index,Cp,will be
(Multiple Choice)
4.8/5 (36)
The Cp measure requires the process to be centered for an accurate measure of process capability.
(True/False)
4.9/5 (29)
Surveys indicate that p charts are used more frequently than average (mean)and range charts are used.
(True/False)
4.8/5 (42)
Filters
- Essay(0)
- Multiple Choice(0)
- Short Answer(0)
- True False(0)
- Matching(0)