Exam 9: Quality Control and Improvement
Exam 1: The Operations Function41 Questions
Exam 2: Operations and Supply Chain Strategy48 Questions
Exam 3: Product Design44 Questions
Exam 4: Process Selection52 Questions
Exam 5: Service Delivery System Design53 Questions
Exam 6: Process-Flow Analysis44 Questions
Exam 7: Lean Thinking and Lean Systems52 Questions
Exam 8: Managing Quality50 Questions
Exam 9: Quality Control and Improvement50 Questions
Exam 10: Forecasting54 Questions
Exam 11: Capacity Planning50 Questions
Exam 12: Scheduling Operations42 Questions
Exam 13: Project Planning and Scheduling39 Questions
Exam 14: Independent Demand Inventory60 Questions
Exam 15: Materials Requirements Planning and ERP44 Questions
Exam 16: Supply Chain Management47 Questions
Exam 17: Sourcing45 Questions
Exam 18: Global Logistics42 Questions
Select questions type
Which of the following is the best description of variables data?
(Multiple Choice)
4.9/5  (26)
(26)
Name the seven tools of quality control typically used in process improvement.Could all of these tools be applied to service operations?
Suggest some possible service operations scenarios wherein we could apply all or some of these tools.
(Essay)
4.8/5 (36)
The ability of the process to meet,or exceed,its specifications can be determined by
(Multiple Choice)
4.8/5 (26)
Which of the following is the best description of quality control?
(Multiple Choice)
5.0/5 (35)
A brewer bottles beer labeled "net weight 12 ounces." A production employee pulled 20 random samples of 5 bottles each throughout the day and found that the average weight is exactly 12 ounces and the average range of the samples is 0.25 ounce.What is the lower control limit for the averages chart for this process?
(Multiple Choice)
4.9/5 (38)
The figure shown below represents a control chart determined from attribute data.Given this chart and the plotted observations,the most appropriate action would be 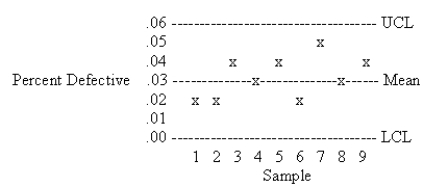
(Multiple Choice)
4.8/5 (35)
Which of the following statements about process quality control is NOT true?
(Multiple Choice)
4.8/5 (40)
Filters
- Essay(0)
- Multiple Choice(0)
- Short Answer(0)
- True False(0)
- Matching(0)