Exam 4: Decision Analysis
For a minimization problem,the conservative approach is often referred to as the
A
How can a good decision maker "improve" luck?
A good decision maker can "improve" luck by adopting strategies that increase the probability of positive outcomes and by being prepared to capitalize on opportunities when they arise. Here are several ways to do this:
1. **Informed Decision Making**: Gather as much information as possible before making a decision. Well-informed decisions are more likely to lead to successful outcomes, which can be perceived as good luck.
2. **Risk Assessment**: Evaluate the risks and rewards associated with different choices. By understanding the potential downsides and upsides, a decision maker can choose options that have a favorable balance, thus increasing the chances of a positive result.
3. **Flexibility and Adaptability**: Be willing to adapt to changing circumstances. Luck often comes from the ability to pivot quickly in response to new information or unexpected situations.
4. **Positive Attitude**: Maintain a positive outlook. People who are optimistic are more likely to recognize and seize opportunities, which can be seen as creating their own luck.
5. **Networking**: Build and maintain a strong network of contacts. Opportunities often come from connections with others, and having a broad network increases the chances of encountering lucky breaks.
6. **Preparation**: Prepare for opportunities by developing skills and resources that will be needed when chances arise. Luck favors the prepared mind, as Louis Pasteur famously said.
7. **Hard Work**: Put in the effort required to succeed. While it may seem like some people are just lucky, often they have worked hard to create opportunities for themselves.
8. **Intuition**: Trust your gut feelings. Sometimes, what seems like luck is actually an intuitive understanding of a situation that guides you to make the right choices at the right time.
9. **Learning from Mistakes**: Learn from past experiences, including failures. Understanding what went wrong in the past can guide future decisions and turn bad luck into good.
10. **Persistence**: Keep trying, even after setbacks. Persistence can make the difference between giving up and being in the right place at the right time when a lucky break happens.
By employing these strategies, a good decision maker can create conditions that are conducive to what is often called "good luck." However, it's important to recognize that not all outcomes are within one's control, and even the best decision-making can't guarantee success every time. Improving luck is about increasing the odds of success, not about ensuring it.
Show how you would design a spreadsheet to calculate revised probabilities for two states of nature and two indicators.
To design a spreadsheet to calculate revised probabilities for two states of nature and two indicators, I would first create a table with the following columns:
1. State of Nature 1
2. State of Nature 2
3. Indicator 1 Probability
4. Indicator 2 Probability
5. Revised Probability for State of Nature 1
6. Revised Probability for State of Nature 2
In the first two columns, I would input the initial probabilities for each state of nature. In the next two columns, I would input the initial probabilities for each indicator.
To calculate the revised probabilities, I would use a formula that takes into account the initial probabilities and the indicators. For example, if Indicator 1 has a high probability in State of Nature 1, the revised probability for State of Nature 1 would increase, and the revised probability for State of Nature 2 would decrease.
I would use conditional formatting to visually represent the changes in probabilities based on the indicators. For example, if the revised probability for State of Nature 1 increases, the cell would be highlighted in green, and if it decreases, the cell would be highlighted in red.
Additionally, I would include a summary section that calculates the overall revised probabilities for each state of nature based on the indicators.
By designing the spreadsheet in this way, it would be easy to input new data for the indicators and quickly see the impact on the revised probabilities for each state of nature. This would provide a clear and visual representation of how the indicators affect the probabilities for different states of nature.
The difference between the expected value of an optimal strategy based on sample information and the "best" expected value without any sample information is called the
Expected value is the sum of the weighted payoff possibilities at a circular node in a decision tree.
Maximizing the expected payoff and minimizing the expected opportunity loss result in the same recommended decision.
A Pacific Northwest lumber company is considering the expansion of one of its mills.The question is whether to do it now,or wait for one year and re-consider.If they expand now,the major factors of importance are the state of the economy and the level of interest rates.The combination of these two factors results in five possible situations.If they do not expand now,only the state of the economy is important and three conditions characterize the possibilities.The following table summarizes the situation: Probabilities Revenues very favorable .2 \ 80,000 favorable .2 \ 60,000 neutral .1 \ 20,000 unfavorable .3 -\ 20,000 very unfavorable .2 -\ 30,000 expansion .2 \ 50,000 steady .5 \ 30,000 contraction .3 \ 10,000
a. Draw the decision tree for this problem.
b. What is the expected value for expanding?
c. What is the expected value for not expanding?
d. Based on expected value, what should the company's decision(s) be?
Fold back this decision tree.Clearly state the decision strategy you determine. 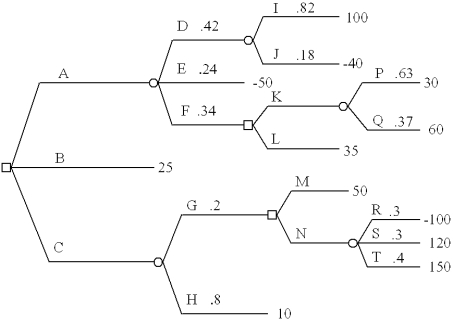
A decision maker has developed the following decision tree.How sensitive is the choice between N and P to the probabilities of states of nature U and V? 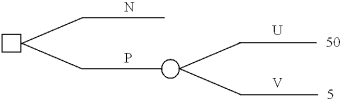
When the expected value approach is used to select a decision alternative,the payoff that actually occurs will usually have a value different from the expected value.
A manufacturing company is considering expanding its production capacity to meet a growing demand for its product line of air fresheners.The alternatives are to build a new plant,expand the old plant,or do nothing.The marketing department estimates a 35 percent probability of a market upturn,a 40 percent probability of a stable market,and a 25 percent probability of a market downturn.Georgia Swain,the firm's capital appropriations analyst,estimates the following annual returns for these alternatives: Market Stable Market Build new plant \ 690,000 \ (130,000) \ (150,000) Expand old plant 490,000 (45,000) (65,000) Do nothing 50,000 0 (20,000)
a. Use a decision tree analysis to analyze these decision alternatives.
b. What should the company do?
c. What returns will accrue to the company if your recommendation is followed?
The options from which a decision maker chooses a course of action are
Super Cola is also considering the introduction of a root beer drink.The company feels that the probability that the product will be a success is .6.The payoff table is as follows: Success(s1) Failure(s2) Produce \ 250,000 -\ 300,000 Do Not Produce -\ 50,000 -\ 20,000 The company has a choice of two research firms to obtain information for this product.Stanton Marketing has market indicators,I1 and I2 for which P(I1 | s1)= .7 and P(I1 | s2)= .4.New World Marketing has indicators J1 and J2 for which P(J1 | s1)= .6 and P(J1 | s2)= .3.
a.What is the optimal decision if neither firm is used? Over what probability of success range is this decision optimal?
b.What is the EVPI?
c.Find the EVSIs and efficiencies for Stanton and New World.
d.If both firms charge $5,000, which firm should be hired?
e.If Stanton charges $10,000 and New World charges $4,000, which firm should Super Cola hire? Why?
Dollar Department Stores has just acquired the chain of Wenthrope and Sons Custom Jewelers.Dollar has received an offer from Harris Diamonds to purchase the Wenthrope store on Grove Street for $120,000.Dollar has determined probability estimates of the store's future profitability,based on economic outcomes,as: P($80,000)= .2,P($100,000)= .3,P($120,000)= .1,and P($140,000)= .4.
a.Should Dollar sell the store on Grove Street?
b.What is the EVPI?
c.Dollar can have an economic forecast performed, costing $10,000, that produces indicators I1 and I2, for which P(I1 | 80,000) = .1; P(I1 | 100,000) = .2; P(I1 | 120,000) = .6; P(I1 | 140,000) = .3. Should Dollar purchase the forecast?
Use graphical sensitivity analysis to determine the range of values of the probability of state of nature s1 over which each of the decision alternatives has its largest expected value. State of Nature Decision 8 10 4 16 10 0
Decision trees are appropriate for multiphase decisions in an environment of certainty.
Filters
- Essay(0)
- Multiple Choice(0)
- Short Answer(0)
- True False(0)
- Matching(0)