Exam 3: Summary Statistics
Exam 1: An Introduction to Econometrics and Statistical Inference16 Questions
Exam 2: Collection and Management of Data16 Questions
Exam 3: Summary Statistics29 Questions
Exam 4: Simple Linear Regression44 Questions
Exam 5: Hypothesis Testing in Linear Regression Analysis34 Questions
Exam 6: Multiple Linear Regression Analysis44 Questions
Exam 7: Qualitative Variables and Non-Linearities in Multiple Linear Regression Analysis40 Questions
Exam 8: Model Selection in Multiple Linear Regression Analysis31 Questions
Exam 9: Heteroskedasticity39 Questions
Exam 10: Time Series Analysis38 Questions
Exam 11: Auto-Correlation50 Questions
Exam 12: Limited Dependent Variables40 Questions
Exam 13: Panel Data31 Questions
Exam 14: Instrumental Variables for Simultaneous Equations, Endogenous Independent Variables, and Measurement Error26 Questions
Exam 15: Quantile Regression, Count Data, Sample Selection Bias, and Quasi-Experimental Methods29 Questions
Select questions type
The standard deviation of a distribution is the
Free
(Multiple Choice)
4.8/5  (40)
(40)
Correct Answer: Verified
D
A smaller standard deviation of a distribution indicates that
Free
(Multiple Choice)
4.8/5 (33)
Correct Answer:Verified
A
A scatter diagram is potentially valuable because it
Free
(Multiple Choice)
4.7/5 (37)
Correct Answer:Verified
A
An outlier that is much smaller than the remaining values in a data set will cause the data set to be
(Multiple Choice)
4.8/5 (33)
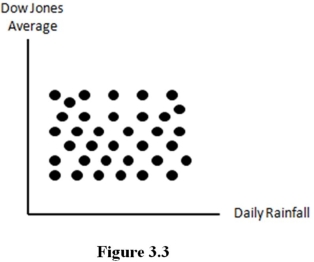 -The scatter diagram in figure suggests that ______ relationship likely exists between daily rainfall and the Dow Jones industrial average.
(Multiple Choice)
4.9/5 (38)
Relative frequency histograms are potentially valuable because they
(Multiple Choice)
4.7/5 (45)
The correlation coefficient is generally preferred to the covariance because
(Multiple Choice)
4.8/5 (37)
When is the median most appropriate for summarizing a data set?
(Multiple Choice)
4.9/5 (29)
Suppose that a data set contains 275 observations ranging from a low of 6,000 to a high of 70,000.What is the appropriate class width to use when constructing a histogram for the data?
(Multiple Choice)
4.8/5 (30)
A counselor working with teenagers is interested in the relationship between anxiety and depression.The counselor administers a depression and anxiety test to each teenager.The scores obtained from the administration of the two inventories are given below. Anxiety Depression 22 16 12 8 68 33 10 6 5 5 53 24 44 18 37 17 0 2 21 14 64 31 33 17 55 30 18 13 3 3 4 4 11 7 13 9 7 5
The summary statistics are Anxiety Depression Sample mean 25.2632 13.7895 Standard deviation 21.9895 9.8464
a.What do these data say about the level of anxiety and depression in these teenagers?
b.What is the correlation between anxiety and depression? What does this number tell you?
c.What is the correlation coefficient between anxiety and depression? What does this number tell you?
d.If you were counseling a teenager with high levels of anxiety,what would you expect their level of depression to be?
(Essay)
4.7/5 (37)
Suppose that you construct the histogram in Figure 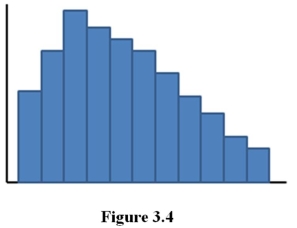 What conclusions would you draw about the data? Explain.
(Essay)
4.9/5 (35)
a.If the correlation coefficient between two random variables equals zero,does that imply that there is no relationship between those random variables?
b.If the correlation coefficient between two random variables is close to one in absolute value,does that imply that one random variable causes another random variable?
(Essay)
4.9/5 (33)
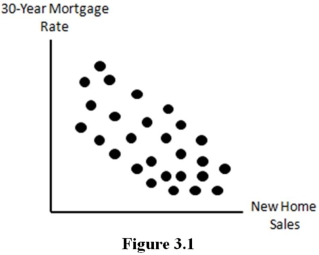 -The scatter diagram in figure suggests that ______ relationship likely exists between 30-year mortgage rates and new home sales.
(Multiple Choice)
4.8/5 (28)
Suppose you have collected the data in Table Table 3.1 2 34 19 5 9 14 25 31 51 22 27 13 14 12 5 21 30 25 15 14
Calculate the mean,median,mode,variance,and standard deviation.Interpret these values.
(Essay)
4.8/5 (32)
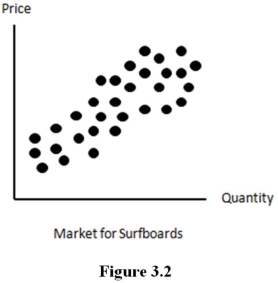 -The scatter diagram in figure suggests that _______ relationship likely exists between the price and quantity supplied of surfboards.
(Multiple Choice)
5.0/5 (42)
The standard deviation of a distribution provides a sense of
(Multiple Choice)
4.8/5 (35)
Filters
- Essay(0)
- Multiple Choice(0)
- Short Answer(0)
- True False(0)
- Matching(0)