Exam 11: Forecasting and Demand Planning
Exam 1: Goods, Services, and Operations Management65 Questions
Exam 2: Value Chains68 Questions
Exam 3: Measuring Performance in Operations81 Questions
Exam 4: Operations Strategy65 Questions
Exam 5: Technology and Operations Management72 Questions
Exam 6: Goods and Service Design91 Questions
Exam 7: Process Selection, Design, and Analysis89 Questions
Exam 8: Facility and Work Design79 Questions
Exam 9: Supply Chain Design71 Questions
Exam 10: Capacity Management70 Questions
Exam 11: Forecasting and Demand Planning76 Questions
Exam 12: Managing Inventories89 Questions
Exam 13: Resource Management82 Questions
Exam 14: Operations Scheduling and Sequencing65 Questions
Exam 15: Quality Management73 Questions
Exam 16: Quality Control and Spc85 Questions
Exam 17: Lean Operating Systems63 Questions
Exam 18: Project Management60 Questions
Select questions type
Judgmental forecasting should only be used if no historical data are available.
Free
(True/False)
4.9/5  (38)
(38)
Correct Answer: Verified
False
Consider the sales for six consecutive weeks for Sam's Strawberries. The sales are in "flats" sold. 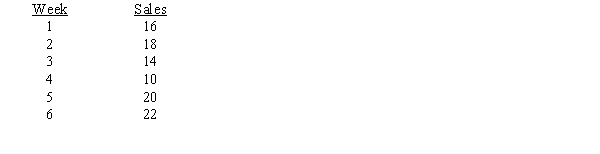 a.Using a 3-period moving average, forecast the sales for weeks four through six.
b.Use exponential smoothing with = .3 to forecast sales for weeks four through six.
c.Use linear regression (time series) to develop a prediction equation that will forecast sales. Then use that prediction equation to get forecasts for weeks four through six.
d.Use MAD to pick the best forecasting method of A through C.
a.Using a 3-period moving average, forecast the sales for weeks four through six.
b.Use exponential smoothing with = .3 to forecast sales for weeks four through six.
c.Use linear regression (time series) to develop a prediction equation that will forecast sales. Then use that prediction equation to get forecasts for weeks four through six.
d.Use MAD to pick the best forecasting method of A through C.
Free
(Essay)
4.8/5 (33)
Correct Answer:Verified
a.Week 4:Week 4: (16 + 18 + 14)/3 = 16.0
Week 5:Week 5: (18 + 14 + 10)/3 = 14.0
Week 6:Week 6: (14 + 10 + 20)/3 = 14.7
b.Ft = Ft1 + (At1-Ft1)
F2 = 10 + .3(16 -10) = 11.8
F3 = 11.8 + .3(18 - 11.8) = 13.7
F4 = 13.7 + .3(14 - 13.7) = 13.8
F5 = 13.8 + .3(10 - 13.8) = 12.7
F6 = 12.7 + .3(20 - 12.7) = 14.9
c.  MAD MA:19.3/3 = 6.43
MAD ES:18.2/3 = 6.07
MAD LR:12.1/3 = 4.03
Linear regression has the lowest MAD.
Ed Rogers owns an appliance store. Sales data on a particular model of a DVD player for the past six months are shown below along with the results of two different forecasting models that were developed. 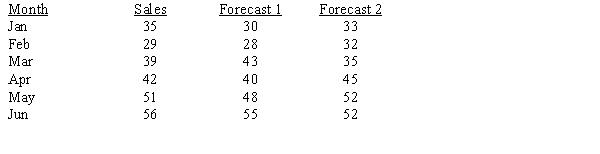 Which is the better forecasting model, based on the MAD criterion?
Free
(Essay)
5.0/5 (40)
Correct Answer:Verified
 MAD (Forecast 1) = 16/6 = 2.67
MAD (Forecast 2) = 17/6 = 2.83
Model 1 is the better model.
A 7-month simple moving average would approximately equate with what alpha ( ) factor for simple exponential smoothing?
(Essay)
4.9/5 (37)
Define regression analysis and explain how it is an approach to forecasting.
(Essay)
4.9/5 (44)
The manager of a gas station along an interstate highway has observed that gasoline sales generally increase each week over the summer months as more families travel by car on vacations. He also believes that sales are sensitive to fluctuations in the price of gasoline. He developed the following regression model:
Sales = 59407 + 509 (Week) -16463 (Price/gallon)
a.Interpret the coefficients of the independent variables in this model.
b.What is the sales forecast for the 11th week of the summer if the price per gallon is estimated to be $3.00?
(Essay)
4.8/5 (36)
MAD, MSE, and MAPE forecast error metrics generally give similar numerical results so it doesn't matter which one is used.
(True/False)
4.9/5 (40)
Using the data shown below, compute the mean square error, mean absolute deviation, and mean absolute percentage error for the forecasts shown. 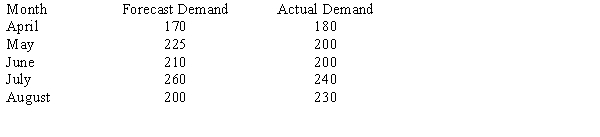
(Essay)
4.8/5 (33)
State Division of Motor Vehicles (DMV) statistics show the rate of new driver's license applications to be as shown below: 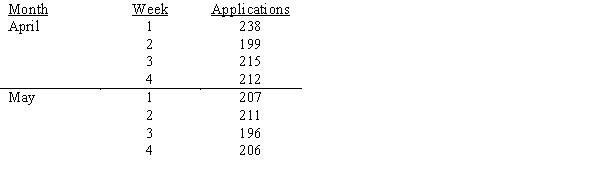 a.Using a 3-week moving average, what is the forecast for the first week in April?
b.Using a 5-week moving average, what is the forecast for the first week in April?
a.Using a 3-week moving average, what is the forecast for the first week in April?
b.Using a 5-week moving average, what is the forecast for the first week in April?
(Essay)
4.7/5 (36)
The Espresso Cart has had the following pattern of espresso sales over the last two weeks: 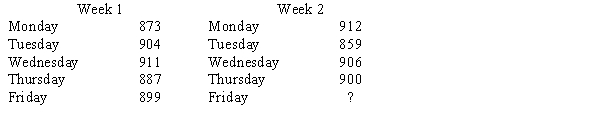 What is the forecast for Friday's sales using a three-day moving average?
(Essay)
4.9/5 (42)
Explain the difference between statistical forecasting and judgment forecasting.
(Essay)
4.8/5 (31)
Ed Rogers owns an appliance store. Sales data on a particular model of a DVD player for the past six months are:  Forecast sales for July using an exponential smoothing model with a smoothing constant of 0.40. Assume that the forecast for May was 36.25.
(Essay)
4.8/5 (41)
What is a time series, and what types of characteristics typically make up time series?
(Essay)
4.9/5 (39)
Single exponential smoothing with a smoothing constant value of .25 puts the same weight on the most recent actual demand as a 4-period moving average.
(True/False)
4.8/5 (33)
The Delphi method is a forecasting approach that is based on expert opinion.
(True/False)
4.7/5 (42)
An R2 of 0.70 mean 30% of the variability in the dependent variable was explained by the independent variable.
(True/False)
4.7/5 (38)
Explain how forecasting is used at different levels of an organization.
(Essay)
4.9/5 (36)
Exponential smoothing models "never forget" past data as long as the smoothing constant is strictly between 0 and 1. In contrast, moving average methods "completely forget" all data older than k periods in the past.
(True/False)
4.9/5 (45)
Which of the following is not one of the five characteristics of a time series?
(Multiple Choice)
4.7/5 (36)
Filters
- Essay(0)
- Multiple Choice(0)
- Short Answer(0)
- True False(0)
- Matching(0)