Exam 10: Statistical Inference About Means and Proportions With Two Populations
Exam 1: Data and Statistics98 Questions
Exam 2: Descriptive Statistics: Tabular and Graphical Presentations64 Questions
Exam 3: Descriptive Statistics: Numerical Measures156 Questions
Exam 4: Introduction to Probability138 Questions
Exam 5: Discrete Probability Distributions122 Questions
Exam 6: Continuous Probability Distributions165 Questions
Exam 7: Sampling and Sampling Distributions131 Questions
Exam 8: Interval Estimation131 Questions
Exam 9: Hypothesis Tests133 Questions
Exam 10: Statistical Inference About Means and Proportions With Two Populations121 Questions
Exam 11: Inferences About Population Variances91 Questions
Exam 12: Tests of Goodness of Fit and Independence80 Questions
Exam 13: Analysis of Variance and Experimental Design113 Questions
Exam 14: Simple Linear Regression140 Questions
Exam 15: Multiple Regression106 Questions
Exam 16: Regression Analysis: Model Building75 Questions
Exam 17: Index Numbers52 Questions
Exam 18: Forecasting67 Questions
Exam 19: Nonparametric Methods81 Questions
Exam 20: Statistical Methods for Quality Control30 Questions
Exam 21: Decision Analysis65 Questions
Exam 22: Sample Survey63 Questions
Select questions type
A test on world history was given to a group of individuals before and also after a film on the history of the world was presented.The results are given below.We want to determine if the film significantly increased the test scores.(For the following matched samples,let the difference "d" be d = after - before. )
 a.Give the hypotheses for this problem.
b.Compute the test statistic.
c.At 95% confidence,test the hypotheses.
a.Give the hypotheses for this problem.
b.Compute the test statistic.
c.At 95% confidence,test the hypotheses.
(Essay)
4.8/5  (31)
(31)
Of 300 female registered voters surveyed,120 indicated they were planning to vote for the incumbent president;while of 400 male registered voters,140 indicated they were planning to vote for the incumbent president.
a.Compute the test statistic.
b.At alpha = .05,test to see if there is a significant difference between the proportions of females and males who plan to vote for the incumbent president.(Use the p-value approach. )
(Essay)
4.9/5 (32)
Exhibit 10-1
Salary information regarding male and female employees of a large company is shown below.
 -Refer to Exhibit 10-1.At 95% confidence,the margin of error is
(Multiple Choice)
4.7/5 (33)
When each data value in one sample is matched with a corresponding data value in another sample,the samples are known as
(Multiple Choice)
4.8/5 (31)
The office of records at a university has stated that the proportion of incoming female students who major in business has increased.A sample of female students taken several years ago is compared with a sample of female students this year.Results are summarized below.Has the proportion increased significantly? Test at = 0.10.

(Essay)
4.9/5 (42)
Exhibit 10-13
In order to determine whether or not there is a significant difference between the hourly wages of two companies,the following data have been accumulated.
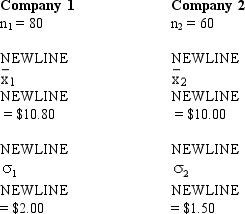 -Refer to Exhibit 10-13.The test statistic has a value of
(Multiple Choice)
4.8/5 (38)
In order to estimate the difference between the average yearly salaries of top managers in private and governmental organizations,the following information was gathered.
 Develop an interval estimate for the difference between the average salaries of the two sectors.Let = .05.
(Essay)
4.8/5 (37)
Exhibit 10-2
The following information was obtained from matched samples.
The daily production rates for a sample of workers before and after a training program are shown below.
 -Refer to Exhibit 10-2.Based on the results of question 18,the
(Multiple Choice)
4.8/5 (26)
In order to estimate the difference between the average age of male and female employees at the Young Corporation,the following information was gathered.
 Develop a 95% confidence interval estimate for the difference between the average age of male and female employees at the Young Corporation.
(Essay)
4.8/5 (29)
Exhibit 10-8
In order to determine whether or not there is a significant difference between the hourly wages of two companies,the following data have been accumulated.
 -Refer to Exhibit 10-8.The test statistic is
(Multiple Choice)
4.8/5 (28)
The following information was obtained from matched samples regarding the productivity of four individuals using two different methods of production.
 Let d = Method 1 - Method 2.Is there a significant difference between the productivity of the two methods? Let = 0.05.
(Essay)
4.9/5 (32)
In order to estimate the difference between the average daily sales of two branches of a department store,the following data has been gathered.
 a.Determine the point estimate of the difference between the means.
b.Determine the degrees of freedom for this interval estimation.
c.Compute the margin of error.
d.Develop a 95% confidence interval for the difference between the two population means.
a.Determine the point estimate of the difference between the means.
b.Determine the degrees of freedom for this interval estimation.
c.Compute the margin of error.
d.Develop a 95% confidence interval for the difference between the two population means.
(Essay)
4.9/5 (34)
The results of a recent poll on the preference of voters regarding the presidential candidates are shown below.
 a.Develop a 90% confidence interval estimate for the difference between the proportion of voters favoring each candidate.
b.Does your confidence interval provide conclusive evidence that one of the candidates is favored more? Explain.
a.Develop a 90% confidence interval estimate for the difference between the proportion of voters favoring each candidate.
b.Does your confidence interval provide conclusive evidence that one of the candidates is favored more? Explain.
(Essay)
4.7/5 (29)
Exhibit 10-4
The following information was obtained from independent random samples.
Assume normally distributed populations with equal variances.
 -Refer to Exhibit 10-4.The degrees of freedom for the t-distribution are
(Multiple Choice)
4.8/5 (29)
The following data present the number of computer units sold per day by a sample of 6 salespersons before and after a bonus plan was implemented.
 At 95% confidence,test to see if the bonus plan was effective.That is,did the bonus plan actually increase sales? Let d = Before - After.
(Essay)
5.0/5 (34)
The following shows the monthly sales in units of six salespersons before and after a bonus plan was introduced.At 95% confidence,determine whether the bonus plan has increased sales significantly.(For the following matched samples,let the difference "d" be: d = after - before. )

(Essay)
4.9/5 (29)
Exhibit 10-5
The following information was obtained from matched samples.
 -Refer to Exhibit 10-5.The 95% confidence interval for the difference between the two population means is
(Multiple Choice)
4.9/5 (34)
Exhibit 10-5
The following information was obtained from matched samples.
-Refer to Exhibit 10-5.The point estimate for the difference between the means of the two populations (Method 1 - Method 2)is
(Multiple Choice)
4.8/5 (31)
Exhibit 10-4
The following information was obtained from independent random samples.
Assume normally distributed populations with equal variances.
-Refer to Exhibit 10-4.The standard error of  Is
Is
(Multiple Choice)
5.0/5 (37)
Filters
- Essay(0)
- Multiple Choice(0)
- Short Answer(0)
- True False(0)
- Matching(0)