Exam 3: Statistical Description of Data
Exam 1: A Preview of Business Statistics55 Questions
Exam 2: Visual Description of Data67 Questions
Exam 3: Statistical Description of Data146 Questions
Exam 4: Data Collection and Sampling Methods104 Questions
Exam 5: Probability: Review of Basic Concepts188 Questions
Exam 6: Discrete Probability Distributions140 Questions
Exam 7: Continuous Probability Distributions160 Questions
Exam 8: Sampling Distributions108 Questions
Exam 9: Estimation From Sample Data150 Questions
Exam 10: Hypothesis Tests Involving a Sample Mean or Proportion170 Questions
Exam 11: Hypothesis Tests Involving Two Sample Means149 Questions
Exam 12: Analysis of Variance Tests173 Questions
Exam 13: Chi-Square Applications134 Questions
Exam 14: Nonparametric Methods139 Questions
Exam 15: Simple Linear Regression and Correlation145 Questions
Exam 16: Multiple Regression and Correlation98 Questions
Exam 17: Model Building83 Questions
Exam 18: Models for Time Series and Forecasting127 Questions
Exam 19: Decision Theory82 Questions
Exam 20: Total Quality Management132 Questions
Select questions type
The range is a measure of dispersion that includes all the values in the data set in the calculation.
(True/False)
4.9/5  (45)
(45)
The first leadoff hitter,the first second baseman,and the smallest player to hit a home run over the 94 foot tall,double decked roof at Tiger Stadium is Detroit's Lou Whitaker.He stands 5' 11" and weighs 160 pounds.Others who have accomplished this same feat are: 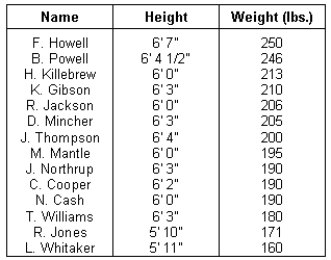 Use Chebyshev's Theorem to estimate how likely one so small (measured in weight)could do it by finding the that lies outside the number of standard deviations the weight 160 is from the mean weight of all the players who have accomplished the feat.
(Essay)
4.7/5 (39)
Intervals
Let x be the class mark for each of the intervals below. Interval Frequency 0-2 2 3-5 6 6-8 10 9-11 5 12-14 2
-Find the sample mean for these grouped data.
(Short Answer)
4.8/5 (41)
Sample values of 13 monthly sales figures (in thousands of dollars)are: 6,5,6,6,7,8,9,10,10,10,9,9,and 6.
What is the median sales figure?
____________________ thousand
(Short Answer)
4.8/5 (40)
Using the grouped data set below,find the sample mean,variance,and sample standard deviation: Part Price Number Purchased \ 0.50 100 0.80 200 0.95 50 1.25 20 0.39 500 = ____________________.
s2 = ____________________.
s = ____________________.
(Short Answer)
4.9/5 (38)
Salaries
The salaries (in thousands of dollars)for a sample of 13 employees of a firm are: 26.5,23.5,29.7,24.8,21.1,24.3,20.4,22.7,27.2,23.7,24.1,24.8,and 28.2.
-Compute the coefficient of variation.
(Short Answer)
4.8/5 (28)
Salaries
The salaries (in thousands of dollars)for a sample of 13 employees of a firm are: 26.5,23.5,29.7,24.8,21.1,24.3,20.4,22.7,27.2,23.7,24.1,24.8,and 28.2.
-Compute the range.
(Short Answer)
4.9/5 (24)
TV Markets
The top twenty TV markets in the United States are: Market TV Homes New York 6,377,180 Los Angeles 4,138,000 Chicago 2,912,020 Philadelphia 2,378,170 San Francisco 1,922,180 Boston-Worcester 1,892,770 Detroit 1,659,020 Cleveland 1,390,300 Washington D.C. 1,339,480 Dallas-Ft. Worth 1,318,340 Houston 1,209,410 Pittsburgh 1,208,260 Miami 1,071,000 Seattle 1,062,040 Minneapolis 1,039,790 Atlanta 1,034,820 St. Louis 1,016,560 Tampa 997,800 Indianapolis 841,510 Baltimore 824,730
-What is the median?
____________________
(Short Answer)
4.9/5 (41)
For each of the past 10 years,the U.S.unemployment rate has been recorded as follows: 6.7,5.5,5.7,5.2,4.5,3.8,3.8,3.6,3.5,and 4.9.Find the mean unemployment rate for this period.
(Short Answer)
5.0/5 (38)
The coefficient of correlation r is a number that indicates the:
(Multiple Choice)
4.8/5 (33)
Measures of ____________________ are numbers that describe the scatter of the data or the extent to which the data values are spread out.
(Short Answer)
4.9/5 (33)
If the coefficient of correlation r is positive,the dependent variable y and the independent variable x are said to be ____________________ related.
(Short Answer)
4.8/5 (35)
You are interested in beginning a small business enterprise and one aspect of your research is to look at the loan record for stockholders of small business corporations.A14-year record of net loans from stockholders of small business corporations (in billions of dollars)are as follows: 1.6,-0.2,1.0,1.4,-0.1,0.6,1.5,0.9,2.2,1.3,1.9,1.9,2.8,and 5.0.
Calculate the mean.
____________________ billion
(Short Answer)
4.8/5 (45)
When a distribution is bell-shaped with the left half identical to the right half,it is:
(Multiple Choice)
4.8/5 (37)
The measure of dispersion which sums the absolute values of the differences between the individual values and the mean,and then divides by the number of individual values is known as the ____________________.
(Short Answer)
4.7/5 (33)
In order to specify the minimum percentage of observations that will fall within a given number of standard deviations from the mean,____________________ applies to any distribution,regardless of shape of the distribution,while the ____________________ applies only to distributions that are bell-shaped and symmetrical.
(Short Answer)
4.8/5 (39)
The box-and-whisker plot is a graphical device that simultaneously displays measures of central tendency and dispersion.
(True/False)
4.9/5 (36)
A perfect straight line sloping upward would produce a correlation coefficient equal to:
(Multiple Choice)
4.8/5 (36)
Salaries
The salaries (in thousands of dollars)for a sample of 13 employees of a firm are: 26.5,23.5,29.7,24.8,21.1,24.3,20.4,22.7,27.2,23.7,24.1,24.8,and 28.2.
-Compute the 90th percentile.
(Short Answer)
4.8/5 (32)
Filters
- Essay(0)
- Multiple Choice(0)
- Short Answer(0)
- True False(0)
- Matching(0)