Exam 3: Statistical Description of Data
Exam 1: A Preview of Business Statistics55 Questions
Exam 2: Visual Description of Data67 Questions
Exam 3: Statistical Description of Data146 Questions
Exam 4: Data Collection and Sampling Methods104 Questions
Exam 5: Probability: Review of Basic Concepts188 Questions
Exam 6: Discrete Probability Distributions140 Questions
Exam 7: Continuous Probability Distributions160 Questions
Exam 8: Sampling Distributions108 Questions
Exam 9: Estimation From Sample Data150 Questions
Exam 10: Hypothesis Tests Involving a Sample Mean or Proportion170 Questions
Exam 11: Hypothesis Tests Involving Two Sample Means149 Questions
Exam 12: Analysis of Variance Tests173 Questions
Exam 13: Chi-Square Applications134 Questions
Exam 14: Nonparametric Methods139 Questions
Exam 15: Simple Linear Regression and Correlation145 Questions
Exam 16: Multiple Regression and Correlation98 Questions
Exam 17: Model Building83 Questions
Exam 18: Models for Time Series and Forecasting127 Questions
Exam 19: Decision Theory82 Questions
Exam 20: Total Quality Management132 Questions
Select questions type
A standardized value that is either a large positive number or a large negative number is a relatively usual occurrence.
(True/False)
4.8/5  (36)
(36)
Which of the measures of central tendency would best represent the data below?
(Multiple Choice)
4.9/5 (34)
The length of the box in the box-and-whisker plot portrays the:
(Multiple Choice)
4.9/5 (40)
The following table represents the number of days that a hardware store experienced various daily demands for a particular hammer during the past 65 days of business.
Daily Demand Number of Days 0 10 1 15 2 12 3 18 4 16 5 4 Determine the average daily demand over this time period.
(Short Answer)
4.8/5 (40)
The ____________________,a variant of the range,is the average of the lowest data value and the highest data value.
(Short Answer)
5.0/5 (37)
A sample of 10 U.S.families spent the following amounts (in dollars)on groceries during a one-week period: 31.36,68.76,12.25,10.85,24.89,31.48,49.52,48.24,30.04,and 25.63.Find the median amount spent on groceries.
(Short Answer)
4.9/5 (26)
Compute the mean,median,and mode from these data: 1.2,1.6,2.1,1.2,1.8,2.2,1.2,1.6,1.8,and 2.0.
Mean = ____________________
Median = ____________________
Mode = ____________________
(Short Answer)
4.8/5 (40)
Cell phone calls
The frequency of cell phone call per day on a certain account is tabulated in the following table:
Calls per Day Number af Days 0-2 12 3-5 8 6-8 5 9-11 3 12-14 1 15-17 1
-Calculate the standard deviation of calls per day.
(Short Answer)
4.8/5 (27)
You are interested in beginning a small business enterprise and one aspect of your research is to look at the loan record for stockholders of small business corporations.A14-year record of net loans from stockholders of small business corporations (in billions of dollars)are as follows: 1.6,-0.2,1.0,1.4,-0.1,0.6,1.5,0.9,2.2,1.3,1.9,1.9,2.8,and 5.0.
Calculate the median.
____________________ billion
(Short Answer)
4.8/5 (39)
Texas Department
A monthly report to the Texas Department of Health,division of Water Hygiene,contained the following water production data in thousands of gallons: 5263 5636 5264 4395 6090 5293 4668 5725 5171 4378 5118 5538 4838 5167 5119 5438 6843 5262 4653 5303 5913 4570 5142 5964 6431 4719 5358 6043 4554 5805
-What are the 1st,2nd,and 3rd quartiles?
Q1 = ____________________
Q2 = ____________________
Q3 = ____________________
(Short Answer)
4.7/5 (37)
A sample of 15 observations has a standard deviation of 4.The sum of the squared deviations from the sample mean is:
(Multiple Choice)
4.8/5 (44)
The numerical value of the coefficient of determination r 2
(Multiple Choice)
4.9/5 (31)
Find the midrange for the following data: 14,99,53,67,16,55,and 11.
(Short Answer)
4.9/5 (33)
Salaries
The salaries (in thousands of dollars)for a sample of 13 employees of a firm are: 26.5,23.5,29.7,24.8,21.1,24.3,20.4,22.7,27.2,23.7,24.1,24.8,and 28.2.
-Compute the first quartile.
(Short Answer)
4.8/5 (37)
In a given data sample,the mean is larger than the median,and both are larger than the mode.Identify and illustrate the shape of the distribution.
(Short Answer)
4.8/5 (40)
Given the following graphic: 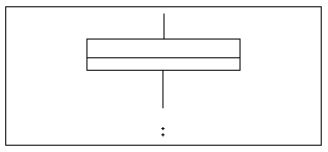 A)What do the asterisks (*)represent?
B)What does the line in the middle of the box represent?
A)What do the asterisks (*)represent?
B)What does the line in the middle of the box represent?
(Essay)
4.9/5 (37)
When a distribution has more values to the right and tails to the left,we say it is skewed positively.
(True/False)
4.8/5 (34)
What is the coefficient of variation of the following sample data set: 12,9,5,23,11,8,16,and 6?
(Short Answer)
4.8/5 (34)
The difference between the largest and smallest values in a data set is called the:
(Multiple Choice)
4.7/5 (26)
Expressed in percentiles,the interquartile range is the difference between the:
(Multiple Choice)
4.9/5 (32)
Filters
- Essay(0)
- Multiple Choice(0)
- Short Answer(0)
- True False(0)
- Matching(0)