Exam 3: Modeling and Solving Lp Problems in a Spreadsheet
Exam 1: Introduction to Modeling and Decision Analysis74 Questions
Exam 2: Introduction to Optimization and Linear Programming73 Questions
Exam 3: Modeling and Solving Lp Problems in a Spreadsheet75 Questions
Exam 4: Sensitivity Analysis and the Simplex Method77 Questions
Exam 5: Network Modeling84 Questions
Exam 6: Integer Linear Programming88 Questions
Exam 7: Goal Programming and Multiple Objective Optimization65 Questions
Exam 8: Nonlinear Programming and Evolutionary Optimization69 Questions
Exam 9: Regression Analysis82 Questions
Exam 10: Data Mining102 Questions
Exam 11: Time Series Forecasting81 Questions
Exam 12: Introduction to Simulation Using Analytic Solver Platform70 Questions
Exam 13: Queuing Theory87 Questions
Exam 14: Decision Analysis116 Questions
Exam 15: Project Management Online65 Questions
Select questions type
A farmer is planning his spring planting.He has 20 acres on which he can plant a combination of Corn,Pumpkins and Beans.He wants to maximize his profit but there is a limited demand for each crop.Each crop also requires fertilizer and irrigation water which are in short supply.There are only 50 acre ft of irrigation available and only 8,000 pounds/acre of fertilizer available.The following table summarizes the data for the problem.
Enter the numbers in the appropriate cells of ranges B12:D12 and E8:F12 in the Excel spreadsheet to solve this problem based on the following formulation.
Let X1 = aces of corn
X2 = acres of pumpkin X3 = acres of beans
MAX: 2100X1 + 900X2 + 1050X3
Subject to: 21X1 ≤ 200
10X2 ≤ 180
3.5X3 ≤ 80
X1 + X2 + X3 ≤ 20 2X1 + 3X2 + 1X3 ≤ 50
5X1 + 4X2 + 3X3 ≤ 80 X1,X2,X3 ≥ 0
A B C D E F 1 Farm Planning Problem 2 3 Corn Pumplin Beans 4 Acres to plant Total Profit: 5 Profit per acre 6 7 Constraints: Used Available 8 Corn demand 9 Pumpkin demand 10 Bean demand 11 Water 12 Fertilizer
Free
(Essay)
4.7/5  (41)
(41)
Correct Answer: Verified
Exhibit 3.1
The following questions are based on this problem and accompanying Excel windows.
Jones Furniture Company produces beds and desks for college students.The production process requires carpentry and varnishing.Each bed requires 6 hours of carpentry and 4 hour of varnishing.Each desk requires 4 hours of carpentry and 8 hours of varnishing.There are 36 hours of carpentry time and 40 hours of varnishing time available.Beds generate $30 of profit and desks generate $40 of profit.Demand for desks is limited,so at most 8 will be produced.
Let X1 = Number of Beds to produce X2 = Number of Desks to produce
The LP model for the problem is
MAX: 30 X1 + 40 X2
Subject to: 6 X1 + 4 X2 ≤ 36 carpentry)
4 X1 + 8 X2 ≤ 40 varnishing)X2 ≤ 8 demand for desks)X1,X2 ≥ 0
1 Jones Furnit 2 ure 3 4 Number to make: Total Profit: 5 Unit profit: 30 40 6 7 Constraints: Use Available 8 Carpentry 6 4 36 9 Varnishing 4 8 40 10 Desk demand 1 8
-Refer to Exhibit 3.1.Which of the following statements represent the carpentry,varnishing and limited demand for desks constraints?
Free
(Multiple Choice)
4.9/5 (44)
Correct Answer:Verified
C
Exhibit 3.1
The following questions are based on this problem and accompanying Excel windows.
Jones Furniture Company produces beds and desks for college students.The production process requires carpentry and varnishing.Each bed requires 6 hours of carpentry and 4 hour of varnishing.Each desk requires 4 hours of carpentry and 8 hours of varnishing.There are 36 hours of carpentry time and 40 hours of varnishing time available.Beds generate $30 of profit and desks generate $40 of profit.Demand for desks is limited,so at most 8 will be produced.
Let X1 = Number of Beds to produce X2 = Number of Desks to produce
The LP model for the problem is
MAX: 30 X1 + 40 X2
Subject to: 6 X1 + 4 X2 ≤ 36 carpentry)
4 X1 + 8 X2 ≤ 40 varnishing)X2 ≤ 8 demand for desks)X1,X2 ≥ 0
1 Jones Furnit 2 ure 3 4 Number to make: Total Profit: 5 Unit profit: 30 40 6 7 Constraints: Use Available 8 Carpentry 6 4 36 9 Varnishing 4 8 40 10 Desk demand 1 8
-Refer to Exhibit 3.1.Which cells should be the constraint cells in this problem?
Free
(Multiple Choice)
4.9/5 (35)
Correct Answer:Verified
C
Which type of spreadsheet cell represents the left hand sides LHS)formulas in an LP model?
(Multiple Choice)
4.9/5 (23)
Exhibit 3.1
The following questions are based on this problem and accompanying Excel windows.
Jones Furniture Company produces beds and desks for college students.The production process requires carpentry and varnishing.Each bed requires 6 hours of carpentry and 4 hour of varnishing.Each desk requires 4 hours of carpentry and 8 hours of varnishing.There are 36 hours of carpentry time and 40 hours of varnishing time available.Beds generate $30 of profit and desks generate $40 of profit.Demand for desks is limited,so at most 8 will be produced.
Let X1 = Number of Beds to produce X2 = Number of Desks to produce
The LP model for the problem is
MAX: 30 X1 + 40 X2
Subject to: 6 X1 + 4 X2 ≤ 36 carpentry)
4 X1 + 8 X2 ≤ 40 varnishing)X2 ≤ 8 demand for desks)X1,X2 ≥ 0
1 Jones Furnit 2 ure 3 4 Number to make: Total Profit: 5 Unit profit: 30 40 6 7 Constraints: Use Available 8 Carpentry 6 4 36 9 Varnishing 4 8 40 10 Desk demand 1 8
-Refer to Exhibit 3.1.Which cells should be changing cells in this problem?
(Multiple Choice)
4.9/5 (35)
A financial planner wants to design a portfolio of investments for a client.The client has $400,000 to invest and the planner has identified four investment options for the money.The following requirements have been placed on the planner.No more than 30% of the money in any one investment,at least one half should be invested in long-term bonds which mature in six or more years,and no more than 40% of the total money should be invested in B or C since they are riskier investments.The planner has developed the following LP model based on the data in this table and the requirements of the client.The objective is to maximize the total return of the portfolio.
Inve5trment Retuin Years to Maturity Rating A 6.45\% 6 1-Eacellent B 5 3-Good C 9.00\% 8 4-Fair D 7.75\% 4 2-Very Good
Formulate the LP for this problem.
(Essay)
4.8/5 (39)
You have been given the following linear programming model and Excel spreadsheet to solve this problem.What cell references would you enter in the Risk Solver Platform RSP)task pane for the following?
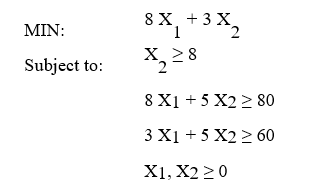 1 2 3 4 Number to make: OBJ. FN. VALUE 5 Unit profit: 6 7 Constraints: Used Available 8 1 1 8 9 2 8 5 80 10 3 3 5 60
(Essay)
4.9/5 (28)
Exhibit 3.5
The following questions are based on this problem and accompanying Excel windows.
A company is planning production for the next 4 quarters.They want to minimize the cost of production.The production cost is stable but demand and production capacity vary from quarter to quarter.The maximum amount of inventory which can be held is 12,000 units and management wants to keep at least 3,000 units on hand.Quarterly
inventory holding cost is 3% of the cost of production.The company estimates the number of units carried in inventory each month by averaging the beginning and ending inventory for each month.There are currently 5,000 units in inventory.The company wants to produce at no less than one half of its maximum capacity in any quarter.
Quarter 1 2 3 4 Unit Production Cost \ 300 \ 300 \ 300 Units Demanded 2,000 9,000 12,000 11,000 Marimum Production 8,000 7,000 8,000 9,000 Let Pi = number of units produced in quarter i,i = 1,... ,4 Bi = beginning inventory for quarter i
MIN: 300 P1 + 300 P2 + 300 P3 + 300 P4 +
9B1 + B2)/2 + 9B2 + B3)/2 + 9B3 + B4)/2 + 9B4 + B5)/2
Subject to: 4000 ≤ P1 ≤ 8000
3500 ≤ P2 ≤ 7000
4000 ≤ P3 ≤ 8000
4500 ≤ P4 ≤ 9000
3000 ≤ B1 + P1 − 2000 ≤ 12000
3000 ≤ B2 + P2 − 9000 ≤ 12000
3000 ≤ B3 + P3 − 12000 ≤ 12000
3000 ≤ B4 + P4 − 11000 ≤ 12000 B2 = B1 + P1 − 2000
B3 = B2 + P2 − 9000
B4 = B3 + P3 − 12000
B5 = B4 + P4 − 11000
Pi,Bi ≥ 0
A B C D E F 1 Quarter 2 1 2 3 4 3 Beginning Inventory 5,000 11,000 9,000 5,000 4 Units Produced 8,000 7,000 8,000 9,000 5 Units Demanded 2,000 9,000 12,000 11,000 6 Ending Inventory 11,000 9,000 5,000 3,000 7 8 Minimum Production 4,000 3,500 4,000 4,500 9 Maximum Production 8,000 7,000 8,000 9,000 10 11 Minimum Inventory 3,000 3,000 3,000 3,000 12 Maximum Inventory 12,000 12,000 12,000 12,000 13 14 Unit Production Cost \ 300 \ 300 \ 300 \ 300 15 Unit Carrying Cost 3.00\% \ 9.00 \ 9.00 \ 9.00 \ 9.00 16 17 Quarterly Production Cost \ 2,400,000 \ 2,100,000 \ 2,400,000 \ 2,700,000 18 Quarterly Carrying Cost \ 72,000 \ 90,000 \ 63,000 \ 36,000 19 20 Total Cost \ 9,861,000
-Refer to Exhibit 3.5.What formula should be entered in cell C18 in the accompanying Excel spreadsheet to compute the quarterly carrying costs?
(Multiple Choice)
4.8/5 (32)
Which type of spreadsheet cell represents the objective function in an LP model?
(Multiple Choice)
4.9/5 (39)
Carlton construction is supplying building materials for a new mall construction project in Kansas.Their contract calls for a total of 250,000 tons of material to be delivered over a three-week period.Carlton's supply depot has access to three modes of transportation: a trucking fleet,railway delivery,and air cargo transport.Their contract calls for 120,000 tons delivered by the end of week one,80% of the total delivered by the end of week two,and the entire amount delivered by the end of week three.Contracts in place with the transportation companies call for at least 45% of the total delivered be delivered by trucking,at least 40% of the total delivered be delivered by railway,and up to 15% of the total delivered be delivered by air cargo.Unfortunately,competing demands limit the availability of each mode of transportation each of the three weeks to the following levels all in thousands of tons):
Week Trucking Limits Railway Limits Air Cargo Limit
 1 45 60 15 2 50 55 10 3 55 45 5 Costs \ per 1000 tons) \ 200 \ 140 \4 00
The following is the LP model for this logistics problem.
1 45 60 15 2 50 55 10 3 55 45 5 Costs \ per 1000 tons) \ 200 \ 140 \4 00
The following is the LP model for this logistics problem.

 What formula goes in cells F10,E3,E4,E5,and B6 of this Excel spreadsheet?
(Essay)
4.9/5 (35)
Exhibit 3.5
The following questions are based on this problem and accompanying Excel windows.
A company is planning production for the next 4 quarters.They want to minimize the cost of production.The production cost is stable but demand and production capacity vary from quarter to quarter.The maximum amount of inventory which can be held is 12,000 units and management wants to keep at least 3,000 units on hand.Quarterly
inventory holding cost is 3% of the cost of production.The company estimates the number of units carried in inventory each month by averaging the beginning and ending inventory for each month.There are currently 5,000 units in inventory.The company wants to produce at no less than one half of its maximum capacity in any quarter.
Quarter 1 2 3 4 Unit Production Cost \ 300 \ 300 \ 300 Units Demanded 2,000 9,000 12,000 11,000 Marimum Production 8,000 7,000 8,000 9,000 Let Pi = number of units produced in quarter i,i = 1,... ,4 Bi = beginning inventory for quarter i
MIN: 300 P1 + 300 P2 + 300 P3 + 300 P4 +
9B1 + B2)/2 + 9B2 + B3)/2 + 9B3 + B4)/2 + 9B4 + B5)/2
Subject to: 4000 ≤ P1 ≤ 8000
3500 ≤ P2 ≤ 7000
4000 ≤ P3 ≤ 8000
4500 ≤ P4 ≤ 9000
3000 ≤ B1 + P1 − 2000 ≤ 12000
3000 ≤ B2 + P2 − 9000 ≤ 12000
3000 ≤ B3 + P3 − 12000 ≤ 12000
3000 ≤ B4 + P4 − 11000 ≤ 12000 B2 = B1 + P1 − 2000
B3 = B2 + P2 − 9000
B4 = B3 + P3 − 12000
B5 = B4 + P4 − 11000
Pi,Bi ≥ 0
A B C D E F 1 Quarter 2 1 2 3 4 3 Beginning Inventory 5,000 11,000 9,000 5,000 4 Units Produced 8,000 7,000 8,000 9,000 5 Units Demanded 2,000 9,000 12,000 11,000 6 Ending Inventory 11,000 9,000 5,000 3,000 7 8 Minimum Production 4,000 3,500 4,000 4,500 9 Maximum Production 8,000 7,000 8,000 9,000 10 11 Minimum Inventory 3,000 3,000 3,000 3,000 12 Maximum Inventory 12,000 12,000 12,000 12,000 13 14 Unit Production Cost \ 300 \ 300 \ 300 \ 300 15 Unit Carrying Cost 3.00\% \ 9.00 \ 9.00 \ 9.00 \ 9.00 16 17 Quarterly Production Cost \ 2,400,000 \ 2,100,000 \ 2,400,000 \ 2,700,000 18 Quarterly Carrying Cost \ 72,000 \ 90,000 \ 63,000 \ 36,000 19 20 Total Cost \ 9,861,000
-Refer to Exhibit 3.5.What formula could be entered in cell F20 in the accompanying Excel spreadsheet to compute the Total Cost for all four quarters?
(Multiple Choice)
4.8/5 (31)
Carlton construction is supplying building materials for a new mall construction project in Kansas.Their contract calls for a total of 250,000 tons of material to be delivered over a three-week period.Carlton's supply depot has access to three modes of transportation: a trucking fleet,railway delivery,and air cargo transport.Their contract calls for 120,000 tons delivered by the end of week one,80% of the total delivered by the end of week two,and the entire amount delivered by the end of week three.Contracts in place with the transportation companies call for at least 45% of the total delivered be delivered by trucking,at least 40% of the total delivered be delivered by railway,and up to 15% of the total delivered be delivered by air cargo.Unfortunately,competing demands limit the availability of each mode of transportation each of the three weeks to the following levels all in thousands of tons):
Week Trucking Limits Railway Limits Air Cargo Limits 1 45 60 15 2 50 55 10 3 55 45 5 Costs \ per 1000 tons) \ 20 \ 14 \ 40 0 0 0
The following is the LP model for this logistics problem.

 What values would you enter in the Risk Solver Platform RSP)task pane for the cells in this Excel spreadsheet implementation of this problem?
Objective Cell: Variables Cells: Constraints Cells:
What values would you enter in the Risk Solver Platform RSP)task pane for the cells in this Excel spreadsheet implementation of this problem?
Objective Cell: Variables Cells: Constraints Cells:
(Essay)
4.9/5 (32)
Exhibit 3.5
The following questions are based on this problem and accompanying Excel windows.
A company is planning production for the next 4 quarters.They want to minimize the cost of production.The production cost is stable but demand and production capacity vary from quarter to quarter.The maximum amount of inventory which can be held is 12,000 units and management wants to keep at least 3,000 units on hand.Quarterly
inventory holding cost is 3% of the cost of production.The company estimates the number of units carried in inventory each month by averaging the beginning and ending inventory for each month.There are currently 5,000 units in inventory.The company wants to produce at no less than one half of its maximum capacity in any quarter.
Quarter 1 2 3 4 Unit Production Cost \ 300 \ 300 \ 300 Units Demanded 2,000 9,000 12,000 11,000 Marimum Production 8,000 7,000 8,000 9,000 Let Pi = number of units produced in quarter i,i = 1,... ,4 Bi = beginning inventory for quarter i
MIN: 300 P1 + 300 P2 + 300 P3 + 300 P4 +
9B1 + B2)/2 + 9B2 + B3)/2 + 9B3 + B4)/2 + 9B4 + B5)/2
Subject to: 4000 ≤ P1 ≤ 8000
3500 ≤ P2 ≤ 7000
4000 ≤ P3 ≤ 8000
4500 ≤ P4 ≤ 9000
3000 ≤ B1 + P1 − 2000 ≤ 12000
3000 ≤ B2 + P2 − 9000 ≤ 12000
3000 ≤ B3 + P3 − 12000 ≤ 12000
3000 ≤ B4 + P4 − 11000 ≤ 12000 B2 = B1 + P1 − 2000
B3 = B2 + P2 − 9000
B4 = B3 + P3 − 12000
B5 = B4 + P4 − 11000
Pi,Bi ≥ 0
A B C D E F 1 Quarter 2 1 2 3 4 3 Beginning Inventory 5,000 11,000 9,000 5,000 4 Units Produced 8,000 7,000 8,000 9,000 5 Units Demanded 2,000 9,000 12,000 11,000 6 Ending Inventory 11,000 9,000 5,000 3,000 7 8 Minimum Production 4,000 3,500 4,000 4,500 9 Maximum Production 8,000 7,000 8,000 9,000 10 11 Minimum Inventory 3,000 3,000 3,000 3,000 12 Maximum Inventory 12,000 12,000 12,000 12,000 13 14 Unit Production Cost \ 300 \ 300 \ 300 \ 300 15 Unit Carrying Cost 3.00\% \ 9.00 \ 9.00 \ 9.00 \ 9.00 16 17 Quarterly Production Cost \ 2,400,000 \ 2,100,000 \ 2,400,000 \ 2,700,000 18 Quarterly Carrying Cost \ 72,000 \ 90,000 \ 63,000 \ 36,000 19 20 Total Cost \ 9,861,000
-Refer to Exhibit 3.5.Which cells are changing cells in the accompanying Excel spreadsheet?
(Multiple Choice)
4.8/5 (33)
How many decision variables are there in a transportation problem which has 5 supply points and 4 demand points?
(Multiple Choice)
4.9/5 (38)
Which of the following describes Data Envelopment Analysis DEA).
(Multiple Choice)
4.8/5 (36)
Exhibit 3.3
The following questions are based on this problem and accompanying Excel windows.
Jack's distillery blends scotches for local bars and saloons.One of his customers has requested a special blend of scotch targeted as a bar scotch.The customer wants the blend to involve two scotch products,call them A and B.Product A is a higher quality scotch while product B is a cheaper brand.The customer wants to make the claim the blend is closer to high quality than the alternative.The customer wants 50 1500 ml bottles of the blend.Each bottle must contain at least 48% of Product A and at least 500 ml of B.The customer also specified that the blend have an alcohol content of at least 85%.Product A contains 95% alcohol while product B contains 78%.The blend is sold for $12.50 per bottle.Product A costs $7 per liter and product B costs $3 per liter.The company wants to determine the blend that will meet the customer's requirements and maximize profit.
Let X1 = Number of liters of product A in total blend delivered X2 = Number of liters of product B in total blend delivered
MIN: 7 X1 + 3 X2
Subject to: X1 + X2 = 1.5 * 50 Total liters of mix)X1 ≥ 0.48 * 1.5 * 50 X1 minimum)
X2 ≥ 0.5 * 50 X2 minimum)
.0.95 X1 + 0.78 X2 ≥ 0.85 * 1.5 * 50 85% alcohol minimum)X1,X2 ≥ 0
A 1 Jacks' Distill ery 2 3 4 Liters to use Total Cost: 5 Unit cost: 10.5 4 6 5 7 Constraints: Supplied Requirement Total Liters 1 1 75 9 A required 1 36 1 B required 1 25 0 1 85\% alcohal 0.95 0.78 63.7 1
-Refer to Exhibit 3.3.What formula should be entered in cell D11 in the accompanying Excel spreadsheet to compute the total liters of alcohol supplied?
(Multiple Choice)
4.9/5 (27)
A farmer is planning his spring planting.He has 20 acres on which he can plant a combination of Corn,Pumpkins and Beans.He wants to maximize his profit but there is a limited demand for each crop.Each crop also requires fertilizer and irrigation water which are in short supply.There are only 50 acre ft of irrigation available and only 8,000 pounds/acre of fertilizer available.The following table summarizes the data for the problem.
Formulate the LP for this problem.
(Essay)
4.8/5 (41)
How many constraints are there in a transportation problem which has 5 supply points and 4 demand points? ignore the non-negativity constraints)
(Multiple Choice)
4.8/5 (37)
Filters
- Essay(0)
- Multiple Choice(0)
- Short Answer(0)
- True False(0)
- Matching(0)