Exam 12: Introduction to Simulation Using Analytic Solver Platform
Exam 1: Introduction to Modeling and Decision Analysis74 Questions
Exam 2: Introduction to Optimization and Linear Programming73 Questions
Exam 3: Modeling and Solving Lp Problems in a Spreadsheet75 Questions
Exam 4: Sensitivity Analysis and the Simplex Method77 Questions
Exam 5: Network Modeling84 Questions
Exam 6: Integer Linear Programming88 Questions
Exam 7: Goal Programming and Multiple Objective Optimization65 Questions
Exam 8: Nonlinear Programming and Evolutionary Optimization69 Questions
Exam 9: Regression Analysis82 Questions
Exam 10: Data Mining102 Questions
Exam 11: Time Series Forecasting81 Questions
Exam 12: Introduction to Simulation Using Analytic Solver Platform70 Questions
Exam 13: Queuing Theory87 Questions
Exam 14: Decision Analysis116 Questions
Exam 15: Project Management Online65 Questions
Select questions type
What function should be used for generating random numbers from the following distribution on the number of phone calls per hour?
A B C D \# of phone calls P\# of phone calls) \# of phone calls P\# of phone calls) 1 2 1 0.10 1 0.10 3 2 0.40 2 0.50 4 3 0.30 3 0.80 5 4 0.15 4 0.95 6 5 0.05 5 1.00
(Essay)
5.0/5  (34)
(34)
Project 12.1 ? Monte Carlo Integration
A common application of Monte Carlo simulation is to provide numerical approximations.One such application is to approximate the area under a curve,or Monte Carlo integration.The following figure represents such a curve,defined over the range of X = 0 to X = 13.Call the area under this curve A.
Monte Carlo integration begins by overlaying on the curve of interest a region call this region,B)whose area is easy to calculate i.e. ,a box).Monte Carlo integration then involves the random generation of points in B and a determination of the percentage of these points that fall in A i.e. ,fall below the curve).This percentage represents that portion of the area of B that is the area of A.
Use Monte Carlo integration techniques to approximate the area under the curve.Use exact techniques to calculate the true area under the curve.How accurate is your approximation? 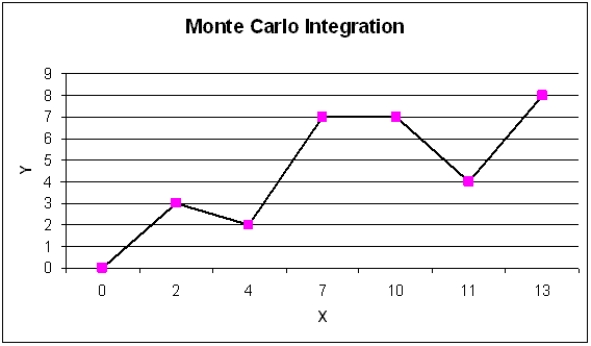
(Essay)
4.8/5 (32)
Exhibit 12.3
The following questions use the information below.
An auto parts store wants to simulate its inventory system for engine oil.The company has collected data on the shipping time for oil and the daily demand for cases of oil.A case of oil generates a $10 profit.Customers can buy oil at any auto parts store so there are no backorders the company loses the sale and profit).The company orders 30 cases whenever the inventory position falls below the reorder point of 15 cases.Orders are placed at the beginning of the day and delivered at the beginning of the day so the oil is available on the arrival day.An average service level of 99% is desired.The following spreadsheets have been developed for this problem.The company has simulated 2 weeks of operation for their inventory system.The current level of on-hand inventory is 25 units and no orders are pending.
1  -Using the information in Exhibit 12.3,what Analytic Solver Platform function should be used in cell D8 and copied to cells D9:D21 of the MODEL sheet to compute daily demand?
(Multiple Choice)
4.8/5 (43)
Exhibit 12.4.
The following questions use the information below.
The manager of a Washington,DC sightseeing tour company is concerned about overbooking for one of his bus tours.The bus has 15 seats but sometimes there are empty seats.His records show that about 20% of ticket holders do not show up for their tour.Tickets cost $10 and are non-refundable.If the manager overbooks the tour and more than 15 passengers show up,some of them will be bumped to a later tour.This bumping costs the company $25 in various expenses to keep the customer happy until the next tour.The manager wants to see what happens to profits if 18 reservations are accepted.
 -Using the information in Exhibit 12.4,what formula should go in cell C15 of the worksheet to determine the Marginal Profit?
(Multiple Choice)
4.9/5 (42)
Exhibit 12.5
The following questions use the information below.
The owner of Sal's Italian Restaurant wants to study the growth of his business using simulation.He is interested in simulating the number of customers and the amount ordered by customers each month.He currently serves 1000 customers per month and feels this can vary uniformly between a decrease of as much as 5% and an increase of up to 9%.The bill for each customer is a normally distributed random variable with a mean of $20 and a standard deviation of $5.The average order has been increasing steadily over the years and the owner expects the mean order will increase by 2% per month.You have created the following spreadsheet to simulate the problem.
-Sal,from Exhibit 12.5,has produced the following spreadsheet to compute confidence intervals on his income.What formula should go in cell B12 to compute the upper limit on a 95% confidence interval for the population proportion below 90%?
A 1 2 Sample Size: 300 3 4 Sample Mean: 4,119,519 5 Sample StandardDeviation 291,117 6 7 95\% LCL for the population mean: 4,086,576 8 95\% UCL for the population mean: 4,152,462 9 10 Target Proportion 0.900 11 95\% Lower Confidence Limit: 0.866 12 95\% Upper Confidence Limit: 0.934
(Essay)
4.8/5 (38)
Jim Johnson operates a bus service to take college students to "The Big City" on Friday night and bring them back to school on Sunday night.The bus has 45 seats but sometimes there are empty seats.His records show that about 5% of ticket holders do not show up for their ride.Tickets cost $20 and are non-refundable.If Jim overbooks the bus and more than 45 passengers show up,some of them will be bumped and have to miss the trip.This bumping costs the company $40 because Jim has a double-your-money back policy for bumped passengers.Jim wants to see what happens to profits if 48 reservations are accepted.
B 1 Jim's Big City Bus 2 Reservation System 3 4 SeatsAvailable 45 5 Ticket Price per Seat \ 20 6 Prob. of No-Show 0.05 7 Cost of Bumping \ 40 8 Reservations Accepted 48 9 10 P assengers to Board 47 11 12 Ticket Revenue \ 960 13 Opp. Cost of Empty Seats 0 14 Cost of Bumping Passengers \ 80 15 Marginal Profit \ 880 MODEL
What formulas should go in cell C10 ? C15 of the worksheet?
(Essay)
4.8/5 (30)
A good way to fit the distribution to historical patterns when historical data is available is to
(Multiple Choice)
4.7/5 (34)
Filters
- Essay(0)
- Multiple Choice(0)
- Short Answer(0)
- True False(0)
- Matching(0)