Exam 23: Aggregate Expenditure and Output in the Short Run
Exam 1: Economics: Foundations and Models444 Questions
Exam 2: Trade-Offs, Comparative Advantage, and the Market System498 Questions
Exam 3: Where Prices Come From: the Interaction of Demand and Supply475 Questions
Exam 4: Economic Efficiency, Government Price Setting, and Taxes419 Questions
Exam 5: Externalities, Environmental Policy, and Public Goods266 Questions
Exam 6: Elasticity: the Responsiveness of Demand and Supply295 Questions
Exam 7: The Economics of Health Care334 Questions
Exam 8: Firms, the Stock Market, and Corporate Governance278 Questions
Exam 9: Comparative Advantage and the Gains From International Trade379 Questions
Exam 10: Consumer Choice and Behavioral Economics302 Questions
Exam 11: Technology, Production, and Costs330 Questions
Exam 12: Firms in Perfectly Competitive Markets298 Questions
Exam 13: Monopolistic Competition: the Competitive Model in a More Realistic Setting276 Questions
Exam 14: Oligopoly: Firms in Less Competitive Markets262 Questions
Exam 15: Monopoly and Antitrust Policy271 Questions
Exam 16: Pricing Strategy263 Questions
Exam 17: The Markets for Labor and Other Factors of Production286 Questions
Exam 18: Public Choice, Taxes, and the Distribution of Income258 Questions
Exam 19: GDP: Measuring Total Production and Income266 Questions
Exam 20: Unemployment and Inflation292 Questions
Exam 21: Economic Growth, the Financial System, and Business Cycles257 Questions
Exam 22: Long-Run Economic Growth: Sources and Policies268 Questions
Exam 23: Aggregate Expenditure and Output in the Short Run306 Questions
Exam 24: Aggregate Demand and Aggregate Supply Analysis284 Questions
Exam 25: Money, Banks, and the Federal Reserve System280 Questions
Exam 26: Monetary Policy277 Questions
Exam 27: Fiscal Policy303 Questions
Exam 28: Inflation, Unemployment, and Federal Reserve Policy257 Questions
Exam 29: Macroeconomics in an Open Economy278 Questions
Exam 30: The International Financial System262 Questions
Select questions type
________ usually increase(s) when the U.S. economy is in a recession and decrease(s) when the U.S. economy is expanding.
(Multiple Choice)
4.8/5  (34)
(34)
Table 23-4
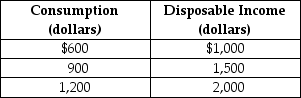 -Refer to Table 23-4. Given the consumption schedule in the table above, the marginal propensity to consume is
(Multiple Choice)
4.9/5 (41)
When we graph consumption as a function of national income rather than as a function of ________, the slope of this consumption function is the ________.
(Multiple Choice)
4.9/5 (34)
________ spending follows a smooth trend whereas, ________ spending is more volatile and subject to fluctuations.
(Multiple Choice)
4.9/5 (28)
The marginal propensity to consume measures the average amount of wealth that a consumer spends in a given period of time.
(True/False)
4.9/5 (29)
If firms are more pessimistic and believe that future profits will fall and remain weak for the next few years, then
(Multiple Choice)
4.9/5 (40)
Table 23-10
 -At each of the three points in the following graph, indicate whether planned aggregate expenditure is greater than, equal to, or less than GDP?
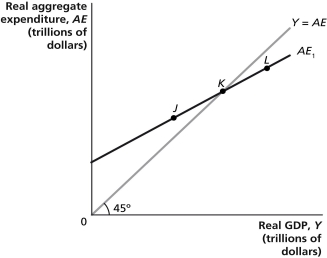
(Essay)
4.8/5 (43)
If the consumption function is defined as C = 5,500 + 0.9Y, what is the marginal propensity to consume?
(Multiple Choice)
4.9/5 (36)
For all points above the 45-degree line, planned aggregate expenditure will be less than GDP.
(True/False)
4.8/5 (42)
If inflation in the United States is higher than inflation in other countries, what will be the effect on net exports for the United States?
(Multiple Choice)
4.7/5 (30)
When net exports equal zero, the economy is in macroeconomic equilibrium.
(True/False)
4.8/5 (21)
The sum of the marginal propensity to consume and the marginal propensity to save is always equal to
(Multiple Choice)
4.7/5 (44)
An increase in the price level in the United States will shift the aggregate expenditure line upward.
(True/False)
4.9/5 (25)
A stock market boom which causes stock prices to rise should cause
(Multiple Choice)
4.9/5 (27)
The five most important variables that determine the level of ________ are disposable income, wealth, expected future income, price level, and interest rate.
(Multiple Choice)
4.9/5 (32)
Article Summary
Although growing at only half the average rate following the seven previous recessions, consumer spending has increased 9 percent since the end of the 2007-2009 recession, and consumer confidence has been on the rise as household finances, the job market, and the housing market continue to improve. The Federal Reserve projects a 3% - 3.5% growth rate for the economy in 2014, up from the recent average of 2%. Debt payments have fallen to an average of 15.69% of after-tax income for households, the lowest level in 30 years, and lower debt payments leave households with more to spend on consumer goods.
Source: Neil Shah, "Pocketbooks Begin to Open As Household Wealth Grows," Wall Street Journal, June 25, 2013.
-Refer to the Article Summary. The increase in consumer spending discussed in the article summary was due in part to lower debt payments which have resulted in an increase in disposable income. The increase in consumption resulting from the increase in disposable income caused a(n) ________ the aggregate expenditure curve.
(Multiple Choice)
4.8/5 (37)
Table 23-6
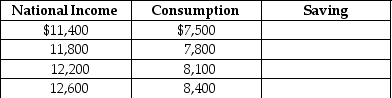 -Given Table 23-6 below, fill in the values for saving. Assume taxes = $800.
(Essay)
4.8/5 (33)
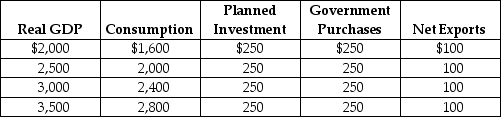
Table 23-5
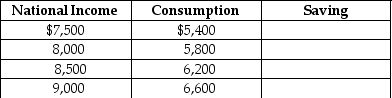 -Given Table 23-5 below, fill in the values for saving. Assume there are no taxes.
(Essay)
4.8/5 (34)
Filters
- Essay(0)
- Multiple Choice(0)
- Short Answer(0)
- True False(0)
- Matching(0)