Exam 14: Describing Relationships: Scatterplots and Correlation
Exam 1: Where Do Data Come From30 Questions
Exam 2: Samples, Good and Bad30 Questions
Exam 3: What Do Samples Tell Us55 Questions
Exam 4: Sample Surveys in the Real World36 Questions
Exam 5: Experiments, Good and Bad50 Questions
Exam 6: Experiments in the Real World32 Questions
Exam 7: Data Ethics21 Questions
Exam 8: Measuring33 Questions
Exam 9: Do the Numbers Make Sense25 Questions
Exam 10: Graphs, Good and Bad30 Questions
Exam 11: Displaying Distributions With Graphs22 Questions
Exam 13: Normal Distributions54 Questions
Exam 14: Describing Relationships: Scatterplots and Correlation56 Questions
Exam 15: Describing Relationships: Regression, Prediction, and Causation37 Questions
Exam 16: The Consumer Price Index and Government Statistics31 Questions
Exam 17: Thinking About Chance25 Questions
Exam 18: Probability Models30 Questions
Exam 19: Simulation20 Questions
Exam 20: The House Edge: Expected Values30 Questions
Exam 21: What Is a Confidence Interval43 Questions
Exam 22: What Is a Test of Significance30 Questions
Exam 23: Use and Abuse of Statistical Inference18 Questions
Exam 24: Two-Way Tables and the Chi-Square Test47 Questions
Select questions type
An agricultural economist says that the correlation between corn prices and rainfall during the growing season is r = -0.7. This means that:
(Multiple Choice)
4.8/5  (35)
(35)
A study of home heating costs collects data on the size of houses and the monthly cost to heat the houses with natural gas. Here are the data:
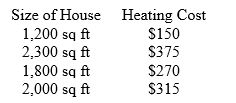 A friend tells you that the correlation for the data is r = 0.99984. You conclude from this number that
(Multiple Choice)
4.7/5 (34)
The scout troop is selling brownies for $4 per plate (no sales tax.) If the explanatory variable was the number of plates of brownies a customer purchased and the response was the amount paid, what would be the correlation between the number of plates and amount paid?
(Multiple Choice)
4.8/5 (25)
Which of the following pairs of variables is most likely to show a positive correlation?
(Multiple Choice)
4.9/5 (36)
You read that "the correlation between spending on schools (dollars per pupil) and median score on student achievement tests is r = 0.08." This means that
(Multiple Choice)
4.8/5 (30)
Consider the following data:
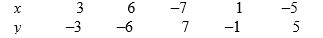 The correlation coefficient r is
(Multiple Choice)
4.8/5 (41)
An analyst gathers data on the number of hours of political debates watched per week and the sales of antacids. She expects that political debate watching will help explain antacid sales.
In a scatterplot of her data:
(Multiple Choice)
4.9/5 (36)
Which of the following are most likely to be positively correlated?
(Multiple Choice)
4.9/5 (44)
The correlation between two variables is of -0.18. One can conclude that:
(Multiple Choice)
4.8/5 (26)
Which correlation indicates almost no straight-line relationship?
(Multiple Choice)
4.9/5 (33)
A random sample of statistics students was selected. The heights (inches) and the weights (pounds) of the students were collected and are displayed in the figure below. 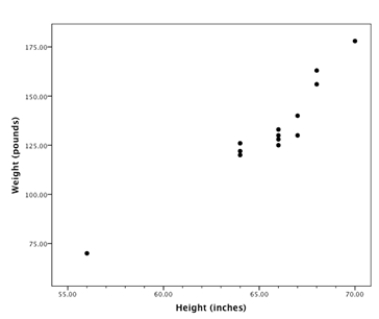 There is a student whose measurements were outliers in the data set. The height of this student was about
(Multiple Choice)
4.8/5 (34)
How well does the number of beers a student drinks predict his or her blood alcohol content? Sixteen student volunteers at The Ohio State University drank a randomly assigned number of cans of beer. Thirty minutes later, a police officer measured their blood alcohol content (BAC). A scatterplot of the data appears below. 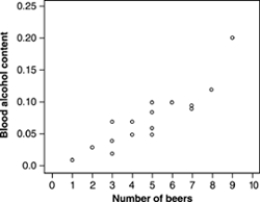 The scatterplot above shows
(Multiple Choice)
4.8/5 (37)
A study found that the size of the police force and the number of churches in towns across the United States are positively associated. This means that:
(Multiple Choice)
4.8/5 (40)
To display the relationship between per capita yearly liquor consumption and liver disease death rates per 100,000 people in each of 29 countries, a good choice of a graph would be a:
(Multiple Choice)
4.7/5 (33)
A nutrition study measured how many helpings of vegetables each of 125 grade school children were served each week during a school year and their body mass index (BMI) scores. Which variable would one put on the horizontal axis of a scatterplot of the data?
(Multiple Choice)
4.9/5 (37)
You calculate the correlation between height and weight for a simple random sample of 50 students from your college. Another student does the same for a simple random sample of 200 students from the college. The other student should get
(Multiple Choice)
4.9/5 (27)
A random sample of patients who attended a clinic was selected. The age of the patient (years) and the number of days since the last visit were collected and are displayed in the figure.  A plausible value of the correlation coefficient for the data displayed is
(Multiple Choice)
4.8/5 (39)
A random sample of patients who attended a clinic was selected. The age of the patient (years) and the number of days since the last visit were collected and are displayed in the figure. 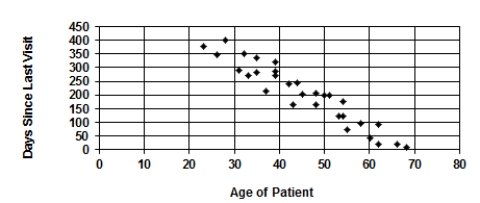 Describe the association between "Age of Patient" and "Days Since Last Visit."
(Multiple Choice)
4.7/5 (34)
Which of the following statements about correlation is false?
(Multiple Choice)
4.8/5 (39)
A study is conducted to determine if there is a relationship between height (inches) and annual income (dollars) among executives at large companies in the United States. Which of the following statements about the descriptive statistics for the study data is not true?
(Multiple Choice)
4.7/5 (32)
Filters
- Essay(0)
- Multiple Choice(0)
- Short Answer(0)
- True False(0)
- Matching(0)