Exam 5: Exponential and Logarithmic Functions
Exam 1: Linear Equations and Functions245 Questions
Exam 2: Quadratic and Other Special Functions120 Questions
Exam 3: Matrices230 Questions
Exam 4: Inequalities and Linear Programming119 Questions
Exam 5: Exponential and Logarithmic Functions109 Questions
Exam 6: Mathematics of Finance131 Questions
Exam 7: Introduction to Probability180 Questions
Exam 8: Further Topics in Probability and Data Description114 Questions
Exam 9: Derivatives249 Questions
Exam 10: Derivatives172 Questions
Exam 11: Derivatives Continued139 Questions
Exam 12: Indefinite Integrals120 Questions
Exam 13: Definite Integrals - Techniques370 Questions
Exam 13: A: Definite Integrals - Techniques370 Questions
Exam 14: Functions of Two or More Variables122 Questions
Exam 15: Algebraic Concepts 240 Questions
Exam 15: Algebraic Concepts 374 Questions
Exam 15: Algebraic Concepts 496 Questions
Exam 15: Algebraic Concepts 599 Questions
Select questions type
The president of a company predicts that sales N will increase after she assumes office and that the number of monthly sales will follow the curve given by 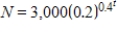 , where t represents time in months since she assumed office. What will the sales be when she assumes office?
(Multiple Choice)
4.9/5  (39)
(39)
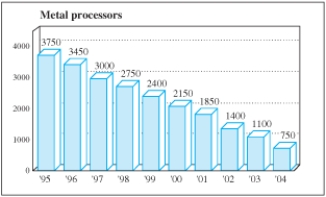
The following figure, from Investor's Business Daily (March 5, 1998), shows how quickly the U.S. metal processing industry isconsolidating. The linear equation that is the best fit for the number of metal processors as a function of years after 1990 is  , and the best exponential fit is
 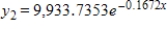 . The linear equation seems to give a much better fit for the data points than the exponential equation. Why then is the exponential equation a more useful model to predict the number of metal processors in
  ?
? 
(Multiple Choice)
4.9/5 (36)
Solve the logarithmic equation 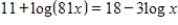 . Round your answer to three decimal places.
(Multiple Choice)
4.9/5 (32)
If the total cost function for a product is  , where x is the number of items produced, what is the total cost of producing 50 units? Round your answer to the nearest cent.
(Multiple Choice)
4.9/5 (28)
Solve the exponential equation. Give answers correct to 3 decimal places. 
(Multiple Choice)
4.8/5 (35)
For selected years from 1978 to 2002, the number of mutual funds N, excluding money market funds, can be modeled by  , where t is the number of years past 1975 (Source: Investment Company Institute, Mutual Fund Fact Book (2003)). Use the model to estimate the year when the number of mutual funds will reach 8,000.
(Multiple Choice)
4.8/5 (44)
Solve the exponential equation. Give the answer correct to 3 decimal places. 
(Multiple Choice)
4.8/5 (43)
Evaluate the logarithm by using properties of logarithms and the following facts. Round your answer two decimal places.

(Multiple Choice)
4.9/5 (29)
By using data from the U.S. Bureau of Labor Statistics for the years 1968-2002, the purchasing power P of a 1983 dollar can be modeled with the function  , where t is the number of years past 1960. In what year will the purchasing power of a 1983 dollar be $0.20? Round-up your answer to the nearest year.
(Multiple Choice)
4.8/5 (41)
Use a change-of-base formula to evaluate  with a calculator or other technology. Round your answer to four decimal places.
(Multiple Choice)
4.8/5 (32)
Use properties of logarithms or a definition to simplify the expression. Check the result with a change-of-base formula and a calculator. Round your answer two decimal places. 
(Multiple Choice)
4.7/5 (39)
The consumer price index (CPI) is calculated by averaging the prices of various items after assigning a weight to each item. The following table gives the consumer price indexes for selected years from 1940 through 2002, reflecting buying patterns of all urban consumers. Find an equation that models these data and use it to predict the consumer price index in 2015. Use the model to predict the consumer price index in 2015. Round your answer to two decimal places.
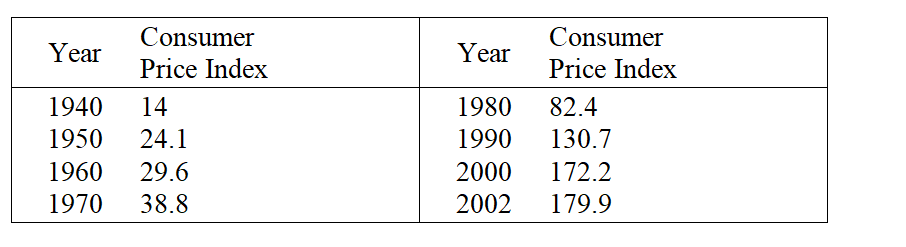
Source: U.S. Bureau of the Census
Source: U.S. Bureau of the Census
(Multiple Choice)
4.7/5 (37)
Write the expression as the sum or difference of two logarithmic functions containing no exponents. 
(Multiple Choice)
4.8/5 (24)
If the supply function for a product is given by  , where q represents the number of hundreds of units, what will be the price when the producers are willing to supply 200 units? Round your answer to the nearest cent.
(Multiple Choice)
4.8/5 (36)
If the demand function for a product is given by  where p is the price per unit when x units are demanded, what is the total revenue when 90 units are demanded and supplied? Round your answer to the nearest cent.
(Multiple Choice)
4.7/5 (27)
Is the function  a growth exponential or decay exponential?
(Multiple Choice)
4.9/5 (35)
The securities industry experienced dramatic growth in the last two decades of the 20th century. The following models for the industry's revenue R and expenses or costs C (both in billions of dollars) were developed as functions of the years past 1980 with data from the U.S. Securities and Exchange Commission's 2000 Annual Report (2001). 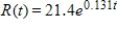 and
and 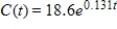 . Use the models to predict the profit for the securities industry in 2009. Round your answer to two decimal places.
(Multiple Choice)
4.9/5 (31)
The purchasing power P (in dollars) of an annual amount of A dollars after t years of 4% inflation decays according to  . How long will it be before a pension of $60,000 per year has a purchasing power of $30,000? Round your answer to one decimal place.
(Multiple Choice)
4.8/5 (37)
Filters
- Essay(0)
- Multiple Choice(0)
- Short Answer(0)
- True False(0)
- Matching(0)