Exam 5: Exponential and Logarithmic Functions
Exam 1: Linear Equations and Functions245 Questions
Exam 2: Quadratic and Other Special Functions120 Questions
Exam 3: Matrices230 Questions
Exam 4: Inequalities and Linear Programming119 Questions
Exam 5: Exponential and Logarithmic Functions109 Questions
Exam 6: Mathematics of Finance131 Questions
Exam 7: Introduction to Probability180 Questions
Exam 8: Further Topics in Probability and Data Description114 Questions
Exam 9: Derivatives249 Questions
Exam 10: Derivatives172 Questions
Exam 11: Derivatives Continued139 Questions
Exam 12: Indefinite Integrals120 Questions
Exam 13: Definite Integrals - Techniques370 Questions
Exam 13: A: Definite Integrals - Techniques370 Questions
Exam 14: Functions of Two or More Variables122 Questions
Exam 15: Algebraic Concepts 240 Questions
Exam 15: Algebraic Concepts 374 Questions
Exam 15: Algebraic Concepts 496 Questions
Exam 15: Algebraic Concepts 599 Questions
Select questions type
Suppose that the market share y (as a percent) that a company expects t months after a new product is introduced is given by 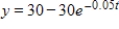 . What is the market share after the first month (to the nearest percent)? Round your answer to two decimal place.
(Multiple Choice)
4.8/5  (34)
(34)
Use properties of logarithms or a definition to simplify the expression.
If  , find
  .
.
(Multiple Choice)
5.0/5 (34)
Evaluate the logarithm by using properties of logarithms and the following facts. Round your answer two decimal places. 

(Multiple Choice)
4.9/5 (31)
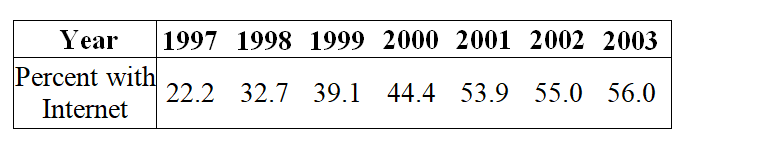
The following table gives the percent of the U.S. population with Internet connections for the years 1997 to 2003. Use a calculator to find the logistic function that models these data and then use the model to predict the percent of the U.S. population with Internet connections in 2015. Use x as the number of years past 1995. Round your answer to one decimal place.
(Multiple Choice)
4.9/5 (37)
The concentration y of a certain drug in the bloodstream t hours after an oral dosage (with  ) is given by the equation
 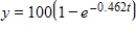 How long does it take for the concentration to reach 90? Round your answer to two decimal places.
(Multiple Choice)
4.9/5 (28)
The demand function for a certain commodity is given by  , where q is number of units. If the price is $1.11 per unit, how many units will be demanded, to the nearest unit?
(Multiple Choice)
5.0/5 (40)
Filters
- Essay(0)
- Multiple Choice(0)
- Short Answer(0)
- True False(0)
- Matching(0)