Exam 5: Exponential and Logarithmic Functions
Exam 1: Linear Equations and Functions245 Questions
Exam 2: Quadratic and Other Special Functions120 Questions
Exam 3: Matrices230 Questions
Exam 4: Inequalities and Linear Programming119 Questions
Exam 5: Exponential and Logarithmic Functions109 Questions
Exam 6: Mathematics of Finance131 Questions
Exam 7: Introduction to Probability180 Questions
Exam 8: Further Topics in Probability and Data Description114 Questions
Exam 9: Derivatives249 Questions
Exam 10: Derivatives172 Questions
Exam 11: Derivatives Continued139 Questions
Exam 12: Indefinite Integrals120 Questions
Exam 13: Definite Integrals - Techniques370 Questions
Exam 13: A: Definite Integrals - Techniques370 Questions
Exam 14: Functions of Two or More Variables122 Questions
Exam 15: Algebraic Concepts 240 Questions
Exam 15: Algebraic Concepts 374 Questions
Exam 15: Algebraic Concepts 496 Questions
Exam 15: Algebraic Concepts 599 Questions
Select questions type
The president of a company predicts that sales N will increase after she assumes office and that the number of monthly sales will follow the curve given by 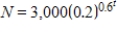 , where t represents time in months since she assumed office. What is the expected upper limit on sales?
(Multiple Choice)
4.8/5  (33)
(33)
The percent concentration y of a certain drug in the bloodstream at any time t in minutes is given by the equation 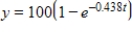 . Graph this function with a graphing utility. Which of the following statements best describes the situation after 10 hours?
(Multiple Choice)
4.7/5 (32)
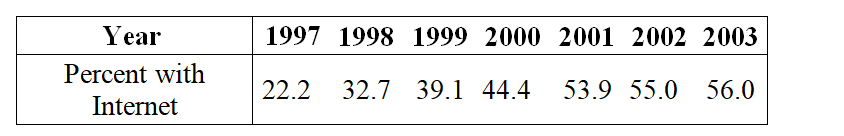
The following table gives the percent of the U.S. population with Internet connections for the years 1997 to 2003. Use a calculator to find the logistic function that models these data and then use the model to predict when 59.4% of the U.S. population will have internet connections. Use x as the number of years past 1995. Round your answer to the nearest year.
(Multiple Choice)
4.9/5 (41)
Suppose the supply of x units of a product at price p dollars per unit is given by 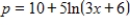 . How many units would be supplied when the price is $50 each? Round your answer to one decimal place.
(Multiple Choice)
4.8/5 (42)
By using data from the U.S. Bureau of Labor Statistics for the years 1968-2002, the purchasing power P of a 1983 dollar can be modeled with the function 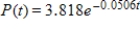 , where t is the number of years past 1960. Based on this model, what is the purchasing power of a 1983 dollar in the year 1970? Round your answer to the nearest cent.
(Multiple Choice)
4.8/5 (33)
Solve the exponential equation. Round your answer to three decimal places, if necessary. 
(Multiple Choice)
4.9/5 (33)
If $6,000 is invested at an annual rate of 9% per year compounded monthly, the future value S at any time t (in months) is given by 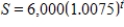 . What is the amount after 1 year? Round your answer to the nearest cent.
(Multiple Choice)
4.9/5 (39)
Use the properties of logarithms to write the expression as a single logarithm. 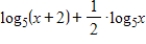
(Multiple Choice)
4.8/5 (32)
Solve for x by writing the equation in exponential form. Round your answer to two decimal places, if necessary. 
(Multiple Choice)
4.9/5 (40)
Solve the exponential equation. Give the answer correct to 3 decimal places. 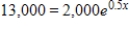
(Multiple Choice)
4.8/5 (29)
Use a calculator to evaluate the expression. Round your answer to two decimal places. 
(Multiple Choice)
4.9/5 (41)
Total personal income in the United States (in billions of dollars) for selected years from 1960 to 2002 is given in the following table.
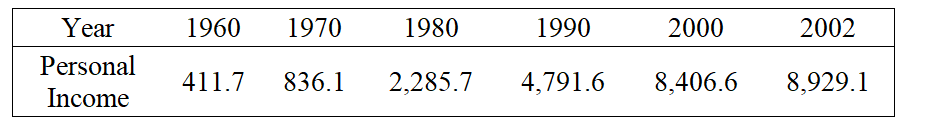 Source: Bureau of Economic Analysis, U.S. Department of Commerce
These data can be modeled by an exponential function. Write the equation of this function, with x as the number of years past 1960. If this model is accurate, what will be the total U.S. personal income in 2010? Round your answer to two decimal places.
Source: Bureau of Economic Analysis, U.S. Department of Commerce
These data can be modeled by an exponential function. Write the equation of this function, with x as the number of years past 1960. If this model is accurate, what will be the total U.S. personal income in 2010? Round your answer to two decimal places.
(Multiple Choice)
4.8/5 (31)
Use a change-of-base formula to rewrite the logarithm in terms of natural logarithms. 
(Multiple Choice)
5.0/5 (37)
Suppose that the equation 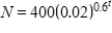 represents the number of employees working t years after a company begins operations. How many employees are there when the company opens (at t = 0)?
(Multiple Choice)
4.8/5 (40)
If the total cost (in dollars) for x units of a product is given by 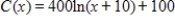 , what is the total cost of producing 150 units? Round your answer to the nearest cent.
(Multiple Choice)
4.8/5 (37)
Use the formula 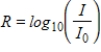 .
In October 2004, an earthquake measuring 6.8 on the Richter scale occurred in Japan. The largest quake in Japan since 1990 was one in 1993 that registered 7.7. How many times more severe was the 1993 shock than the one in 2004 on the Richter scale? Round your answer to one decimal place.
.
In October 2004, an earthquake measuring 6.8 on the Richter scale occurred in Japan. The largest quake in Japan since 1990 was one in 1993 that registered 7.7. How many times more severe was the 1993 shock than the one in 2004 on the Richter scale? Round your answer to one decimal place.
(Multiple Choice)
4.9/5 (35)
Filters
- Essay(0)
- Multiple Choice(0)
- Short Answer(0)
- True False(0)
- Matching(0)