Exam 5: Exponential and Logarithmic Functions
Exam 1: Linear Equations and Functions245 Questions
Exam 2: Quadratic and Other Special Functions120 Questions
Exam 3: Matrices230 Questions
Exam 4: Inequalities and Linear Programming119 Questions
Exam 5: Exponential and Logarithmic Functions109 Questions
Exam 6: Mathematics of Finance131 Questions
Exam 7: Introduction to Probability180 Questions
Exam 8: Further Topics in Probability and Data Description114 Questions
Exam 9: Derivatives249 Questions
Exam 10: Derivatives172 Questions
Exam 11: Derivatives Continued139 Questions
Exam 12: Indefinite Integrals120 Questions
Exam 13: Definite Integrals - Techniques370 Questions
Exam 13: A: Definite Integrals - Techniques370 Questions
Exam 14: Functions of Two or More Variables122 Questions
Exam 15: Algebraic Concepts 240 Questions
Exam 15: Algebraic Concepts 374 Questions
Exam 15: Algebraic Concepts 496 Questions
Exam 15: Algebraic Concepts 599 Questions
Select questions type
The consumer price index (CPI) is calculated by averaging the prices of various items after assigning a weight to each item. The following table gives the consumer price indexes for selected years from 1940 through 2002, reflecting buying patterns of all urban consumers, with x representing years past 1900. Find an equation that models these data. If it's necessary, round your calculations to four decimal places.
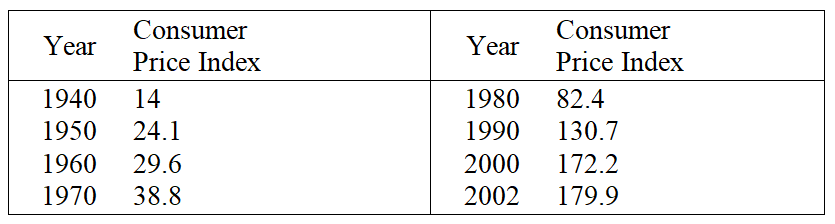
Source: U.S. Bureau of the Census
Source: U.S. Bureau of the Census
(Multiple Choice)
4.9/5  (47)
(47)
The demand function for a certain commodity is given by  , where q is number of units. At what price per unit will the quantity demanded equal 6 units? Round your answer to the nearest cent.
(Multiple Choice)
4.8/5 (40)
For selected years from 1960 to 2001, the national health care expenditures H, in billions of dollars, can be modeled by 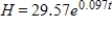 , where t is the number of years past 1960 (Source: U.S. Department of Health and Human Services). If this model remains accurate, in what year will national health care expenditures reach $3 trillion (that is, $3000 billion)? Round your answer to the nearest year.
(Multiple Choice)
4.8/5 (31)
Total personal income in the United States (in billions of dollars) for selected years from 1960 to 2002 is given in the following table.
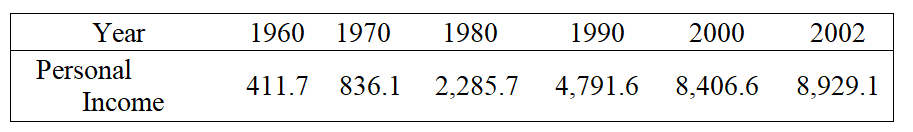 Source: Bureau of Economic Analysis, U.S. Department of Commerce
These data can be modeled by an exponential function. Write the equation of this function, with x as the number of years past 1960. If it's necessary round your calculations to four decimal places.
Source: Bureau of Economic Analysis, U.S. Department of Commerce
These data can be modeled by an exponential function. Write the equation of this function, with x as the number of years past 1960. If it's necessary round your calculations to four decimal places.
(Multiple Choice)
4.9/5 (31)
Use a calculator to evaluate the expression. Round your answer to six decimal places. 
(Multiple Choice)
4.9/5 (44)
The monthly sales S for a product is given by 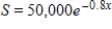 , where x is the number of months that have passed since the end of a promotional campaign. Determine the monthly sales 4 months after the promotional campaign. Round your answer to the nearest cent.
(Multiple Choice)
4.8/5 (38)
Write the expression as the sum or difference of two logarithmic functions containing no exponents. 
(Multiple Choice)
4.8/5 (33)
Suppose that the equation 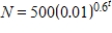 represents the number of employees working t years after a company begins operations. After how many years will at least 300 employees be working? Round your answer to two decimal places.
(Multiple Choice)
4.8/5 (41)
The following table gives the average number of students per computer in public schools for the school years that ended in 1985 through 2002. Let x be the number of years past 1980. Find an exponential model for these data. Round your answer to three decimal places.
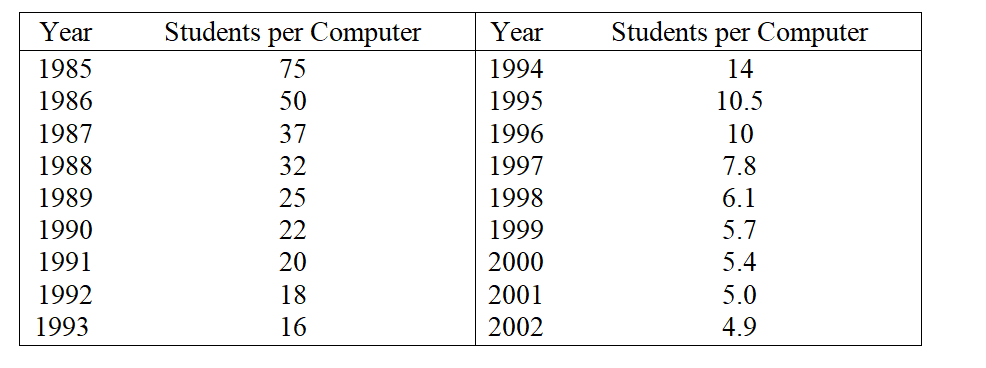 Source: Quality Education Data, Inc., Denver, Colorado
(Multiple Choice)
4.7/5 (37)
Let 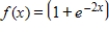 . Using a graphing utility, graph
 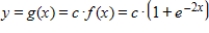 for
for  and
and  . What effect does c have on the graphs?
(Multiple Choice)
4.8/5 (32)
Pollution levels in Lake Erie have been modeled by the equation 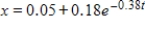 , where x is the volume of pollutants (in cubic kilometers) and t is the time (in years) (Adapted from R. H. Rainey, Science 155 (1967), 1242-1243). Find the initial pollution level; that is, find x when t=0.
(Multiple Choice)
4.9/5 (35)
If $7,000 is invested at an annual rate of 11.5% compounded continuously, the future value S at any time t (in years) is given by 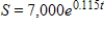 . What is the amount after 12 months? Round your answer to the nearest cent.
(Multiple Choice)
4.8/5 (42)
Solve for x by writing the equation in exponential form. 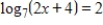
(Multiple Choice)
4.8/5 (36)
Solve for x by writing the equation in exponential form. Round your answer two decimal places, if necessary. 
(Multiple Choice)
4.7/5 (36)
A starfish population can be modeled by  , where
  is the number of individuals at time
  , r is the yearly rate of growth, and t is the number of years. Sketch the graph for
  to
to  when the growth rate is 2.1% and
  is 5.5 billion. All numbers on the vertical axis are in billions.
(Multiple Choice)
4.8/5 (34)
For selected years from 1978 to 2002, the number of mutual funds N, excluding money market funds, can be modeled by 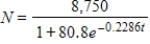 , where t is the number of years past 1975 (Source: Investment Company Institute, Mutual Fund Fact Book (2003)). Use the model to estimate the number of mutual funds in 2004. Round your answer to the nearest whole number.
(Multiple Choice)
4.8/5 (30)
Let  . Use a graphing utility to graph the functions
  and
and  where
where  . Identify the graphs of
  and
and  below.
(Multiple Choice)
4.9/5 (28)
Use the formula 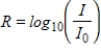 .
The San Francisco earthquake of 1906 measured 8.25 on the Richter scale, and the San Francisco earthquake of 1989 measured 7.1. How much more intense was the 1906 quake?
.
The San Francisco earthquake of 1906 measured 8.25 on the Richter scale, and the San Francisco earthquake of 1989 measured 7.1. How much more intense was the 1906 quake?
(Multiple Choice)
4.8/5 (33)
Use a calculator to evaluate the expression. Round your answer to two decimal places, if necessary. 
(Multiple Choice)
4.9/5 (42)
Filters
- Essay(0)
- Multiple Choice(0)
- Short Answer(0)
- True False(0)
- Matching(0)