Exam 2: Methods in Psychology-Part B
Exam 1: Evolution of Psychological Science-Part A323 Questions
Exam 1: Evolution of Psychological Science-Part B14 Questions
Exam 1: Evolution of Psychological Science-Part C98 Questions
Exam 1: Evolution of Psychological Science-Part D15 Questions
Exam 1: Evolution of Psychological Science-Part E15 Questions
Exam 2: Methods in Psychology-Part A295 Questions
Exam 2: Methods in Psychology-Part B13 Questions
Exam 2: Methods in Psychology-Part C73 Questions
Exam 2: Methods in Psychology-Part D15 Questions
Exam 2: Methods in Psychology-Part E14 Questions
Exam 3: Neuroscience and Behavior-Part A424 Questions
Exam 3: Neuroscience and Behavior-Part B12 Questions
Exam 3: Neuroscience and Behavior-Part C122 Questions
Exam 3: Neuroscience and Behavior-Part D15 Questions
Exam 3: Neuroscience and Behavior-Part E15 Questions
Exam 4: Sensation and Perception-Part A365 Questions
Exam 4: Sensation and Perception-Part B12 Questions
Exam 4: Sensation and Perception-Part C147 Questions
Exam 4: Sensation and Perception-Part D15 Questions
Exam 4: Sensation and Perception-Part E15 Questions
Exam 5: Consciousness-Part A264 Questions
Exam 5: Consciousness-Part B13 Questions
Exam 5: Consciousness-Part C102 Questions
Exam 5: Consciousness-Part D15 Questions
Exam 5: Consciousness-Part E15 Questions
Exam 6: Memory-Part A346 Questions
Exam 6: Memory-Part B11 Questions
Exam 6: Memory-Part C99 Questions
Exam 6: Memory-Part D15 Questions
Exam 6: Memory-Part E15 Questions
Exam 7: Learning-Part A291 Questions
Exam 7: Learning-Part B13 Questions
Exam 7: Learning-Part C134 Questions
Exam 7: Learning-Part D16 Questions
Exam 7: Learning-Part E15 Questions
Exam 8: Emotion and Motivation-Part A231 Questions
Exam 8: Emotion and Motivation-Part B12 Questions
Exam 8: Emotion and Motivation-Part C91 Questions
Exam 8: Emotion and Motivation-Part D15 Questions
Exam 8: Emotion and Motivation-Part E15 Questions
Exam 9: Language and Thought-Part A242 Questions
Exam 9: Language and Thought-Part B12 Questions
Exam 9: Language and Thought-Part C107 Questions
Exam 9: Language and Thought-Part D15 Questions
Exam 9: Language and Thought-Part E15 Questions
Exam 10: Intelligence-Part A187 Questions
Exam 10: Intelligence-Part B12 Questions
Exam 10: Intelligence-Part C84 Questions
Exam 10: Intelligence-Part D15 Questions
Exam 10: Intelligence-Part E12 Questions
Exam 11: Development-Part A261 Questions
Exam 11: Development-Part B14 Questions
Exam 11: Development-Part C83 Questions
Exam 11: Development-Part D15 Questions
Exam 11: Development-Part E15 Questions
Exam 12: Personality-Part A252 Questions
Exam 12: Personality-Part B12 Questions
Exam 12: Personality-Part C75 Questions
Exam 12: Personality-Part D15 Questions
Exam 12: Personality-Part E15 Questions
Exam 13: Social Psychology-Part A238 Questions
Exam 13: Social Psychology-Part B16 Questions
Exam 13: Social Psychology-Part C81 Questions
Exam 13: Social Psychology-Part D15 Questions
Exam 13: Social Psychology-Part E15 Questions
Exam 14: Stress and Health-Part A186 Questions
Exam 14: Stress and Health-Part B12 Questions
Exam 14: Stress and Health-Part C84 Questions
Exam 14: Stress and Health-Part D15 Questions
Exam 14: Stress and Health-Part E15 Questions
Exam 15: Psychological Disorders-Part A282 Questions
Exam 15: Psychological Disorders-Part B12 Questions
Exam 15: Psychological Disorders-Part C57 Questions
Exam 15: Psychological Disorders-Part D15 Questions
Exam 15: Psychological Disorders-Part E15 Questions
Exam 16: Treatment of Psychological Disorders-Part A212 Questions
Exam 16: Treatment of Psychological Disorders-Part B12 Questions
Exam 16: Treatment of Psychological Disorders-Part C95 Questions
Exam 16: Treatment of Psychological Disorders-Part D14 Questions
Exam 16: Treatment of Psychological Disorders-Part E15 Questions
Exam 17: Psychology Appendix214 Questions
Select questions type
Use the following to answer questions
Scenario II
A psychologist was interested in the effects of sleep deprivation on performance on a vigilance task.Forty college students served as participants and were placed in either the sleep-deprivation group or the control group by coin flip.Both groups spent the night before the study in a sleep laboratory,but only the control group was allowed to sleep.By the next morning,the sleep-deprived group had been awake for the last 24 hours.At this time,both groups were provided a nutritious breakfast and,shortly thereafter,testing began in sound-attenuating cubicles,each equipped with a computer.The vigilance task consisted of monitoring the computer screen.Participants were instructed that red dots represented allied spacecraft and green dots represented enemy spacecraft.Throughout the 2-hour-long task,red dots moved across the screen in irregular patterns.Occasionally and unpredictably,a green dot would quickly move across the screen in a haphazard pattern.When a green dot appeared,the task of the participant was to move a stylus over the green dot and press a button,"destroying" the enemy spacecraft.The psychologist measured the percentage of these enemy targets that were detected and destroyed.
The results of this fictitious experiment are shown in Figure 2.2.
Figure 2.2 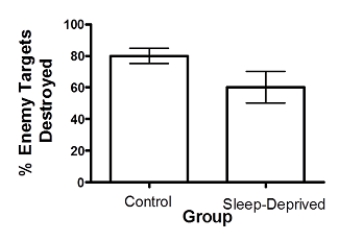 -(Scenario II)The purpose of placing participants into one of the two groups by coin flip was to:
Free
(Multiple Choice)
5.0/5  (33)
(33)
Correct Answer: Verified
C
Use the following to answer questions
Scenario I
Examine Figure 2.1 and then answer the following questions. 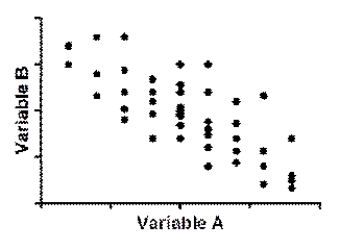 -(Scenario I)Which pair is MOST likely to represent variables A and B?
Free
(Multiple Choice)
4.9/5 (35)
Correct Answer:Verified
D
Use the following to answer questions
Scenario II
A psychologist was interested in the effects of sleep deprivation on performance on a vigilance task.Forty college students served as participants and were placed in either the sleep-deprivation group or the control group by coin flip.Both groups spent the night before the study in a sleep laboratory,but only the control group was allowed to sleep.By the next morning,the sleep-deprived group had been awake for the last 24 hours.At this time,both groups were provided a nutritious breakfast and,shortly thereafter,testing began in sound-attenuating cubicles,each equipped with a computer.The vigilance task consisted of monitoring the computer screen.Participants were instructed that red dots represented allied spacecraft and green dots represented enemy spacecraft.Throughout the 2-hour-long task,red dots moved across the screen in irregular patterns.Occasionally and unpredictably,a green dot would quickly move across the screen in a haphazard pattern.When a green dot appeared,the task of the participant was to move a stylus over the green dot and press a button,"destroying" the enemy spacecraft.The psychologist measured the percentage of these enemy targets that were detected and destroyed.
The results of this fictitious experiment are shown in Figure 2.2.
Figure 2.2
-(Scenario II)Shown in Figure 6.2 is the mean and standard deviation of each group's performance.Based only on this figure,what can be concluded?
Free
(Multiple Choice)
4.9/5 (45)
Correct Answer:Verified
D
Use the following to answer questions
Scenario I
Examine Figure 2.1 and then answer the following questions.
-(Scenario I)Each data point on the scatterplot represents:
(Multiple Choice)
4.8/5 (30)
Use the following to answer questions
Scenario I
Examine Figure 2.1 and then answer the following questions.
-(Scenario I)Which value is MOST likely to be the correlation coefficient (r)between variables A and B?
(Multiple Choice)
5.0/5 (38)
Use the following to answer questions
Scenario II
A psychologist was interested in the effects of sleep deprivation on performance on a vigilance task.Forty college students served as participants and were placed in either the sleep-deprivation group or the control group by coin flip.Both groups spent the night before the study in a sleep laboratory,but only the control group was allowed to sleep.By the next morning,the sleep-deprived group had been awake for the last 24 hours.At this time,both groups were provided a nutritious breakfast and,shortly thereafter,testing began in sound-attenuating cubicles,each equipped with a computer.The vigilance task consisted of monitoring the computer screen.Participants were instructed that red dots represented allied spacecraft and green dots represented enemy spacecraft.Throughout the 2-hour-long task,red dots moved across the screen in irregular patterns.Occasionally and unpredictably,a green dot would quickly move across the screen in a haphazard pattern.When a green dot appeared,the task of the participant was to move a stylus over the green dot and press a button,"destroying" the enemy spacecraft.The psychologist measured the percentage of these enemy targets that were detected and destroyed.
The results of this fictitious experiment are shown in Figure 2.2.
Figure 2.2
-(Scenario II)Vigilance was measured as the percentage of "enemy targets" destroyed.As a measure of vigilance,this illustrates:
(Multiple Choice)
4.7/5 (41)
Use the following to answer questions
Scenario I
Examine Figure 2.1 and then answer the following questions.
-(Scenario I)Which statement is true given that variables A and B are significantly correlated?
(Multiple Choice)
4.8/5 (29)
Use the following to answer questions
Scenario II
A psychologist was interested in the effects of sleep deprivation on performance on a vigilance task.Forty college students served as participants and were placed in either the sleep-deprivation group or the control group by coin flip.Both groups spent the night before the study in a sleep laboratory,but only the control group was allowed to sleep.By the next morning,the sleep-deprived group had been awake for the last 24 hours.At this time,both groups were provided a nutritious breakfast and,shortly thereafter,testing began in sound-attenuating cubicles,each equipped with a computer.The vigilance task consisted of monitoring the computer screen.Participants were instructed that red dots represented allied spacecraft and green dots represented enemy spacecraft.Throughout the 2-hour-long task,red dots moved across the screen in irregular patterns.Occasionally and unpredictably,a green dot would quickly move across the screen in a haphazard pattern.When a green dot appeared,the task of the participant was to move a stylus over the green dot and press a button,"destroying" the enemy spacecraft.The psychologist measured the percentage of these enemy targets that were detected and destroyed.
The results of this fictitious experiment are shown in Figure 2.2.
Figure 2.2
-(Scenario II)The dependent variable was:
(Multiple Choice)
4.9/5 (44)
Use the following to answer questions
Scenario II
A psychologist was interested in the effects of sleep deprivation on performance on a vigilance task.Forty college students served as participants and were placed in either the sleep-deprivation group or the control group by coin flip.Both groups spent the night before the study in a sleep laboratory,but only the control group was allowed to sleep.By the next morning,the sleep-deprived group had been awake for the last 24 hours.At this time,both groups were provided a nutritious breakfast and,shortly thereafter,testing began in sound-attenuating cubicles,each equipped with a computer.The vigilance task consisted of monitoring the computer screen.Participants were instructed that red dots represented allied spacecraft and green dots represented enemy spacecraft.Throughout the 2-hour-long task,red dots moved across the screen in irregular patterns.Occasionally and unpredictably,a green dot would quickly move across the screen in a haphazard pattern.When a green dot appeared,the task of the participant was to move a stylus over the green dot and press a button,"destroying" the enemy spacecraft.The psychologist measured the percentage of these enemy targets that were detected and destroyed.
The results of this fictitious experiment are shown in Figure 2.2.
Figure 2.2
-(Scenario II)The independent variable was:
(Multiple Choice)
4.9/5 (42)
Use the following to answer questions
Scenario II
A psychologist was interested in the effects of sleep deprivation on performance on a vigilance task.Forty college students served as participants and were placed in either the sleep-deprivation group or the control group by coin flip.Both groups spent the night before the study in a sleep laboratory,but only the control group was allowed to sleep.By the next morning,the sleep-deprived group had been awake for the last 24 hours.At this time,both groups were provided a nutritious breakfast and,shortly thereafter,testing began in sound-attenuating cubicles,each equipped with a computer.The vigilance task consisted of monitoring the computer screen.Participants were instructed that red dots represented allied spacecraft and green dots represented enemy spacecraft.Throughout the 2-hour-long task,red dots moved across the screen in irregular patterns.Occasionally and unpredictably,a green dot would quickly move across the screen in a haphazard pattern.When a green dot appeared,the task of the participant was to move a stylus over the green dot and press a button,"destroying" the enemy spacecraft.The psychologist measured the percentage of these enemy targets that were detected and destroyed.
The results of this fictitious experiment are shown in Figure 2.2.
Figure 2.2
-(Scenario II)Assuming the differences between groups were statistically significant,before concluding that sleep deprivation impairs vigilance,another dependent variable the researchers probably would want to analyze is:
(Multiple Choice)
4.8/5 (36)
Use the following to answer questions
Scenario I
Examine Figure 2.1 and then answer the following questions.
-(Scenario I)In a simple correlational design,how would these data be collected?
(Multiple Choice)
4.7/5 (40)
Use the following to answer questions
Scenario II
A psychologist was interested in the effects of sleep deprivation on performance on a vigilance task.Forty college students served as participants and were placed in either the sleep-deprivation group or the control group by coin flip.Both groups spent the night before the study in a sleep laboratory,but only the control group was allowed to sleep.By the next morning,the sleep-deprived group had been awake for the last 24 hours.At this time,both groups were provided a nutritious breakfast and,shortly thereafter,testing began in sound-attenuating cubicles,each equipped with a computer.The vigilance task consisted of monitoring the computer screen.Participants were instructed that red dots represented allied spacecraft and green dots represented enemy spacecraft.Throughout the 2-hour-long task,red dots moved across the screen in irregular patterns.Occasionally and unpredictably,a green dot would quickly move across the screen in a haphazard pattern.When a green dot appeared,the task of the participant was to move a stylus over the green dot and press a button,"destroying" the enemy spacecraft.The psychologist measured the percentage of these enemy targets that were detected and destroyed.
The results of this fictitious experiment are shown in Figure 2.2.
Figure 2.2
-(Scenario II)Participants were placed into groups using:
(Multiple Choice)
4.8/5 (39)
Use the following to answer questions
Scenario I
Examine Figure 2.1 and then answer the following questions.
-(Scenario I)Figure 2.1 illustrates a _____ correlation between variables A and B.
(Multiple Choice)
4.8/5 (29)
Filters
- Essay(0)
- Multiple Choice(0)
- Short Answer(0)
- True False(0)
- Matching(0)