Exam 9: An Introduction to the Short Run
Exam 1: Introduction to Macroeconomics35 Questions
Exam 2: Measuring the Macroeconomy111 Questions
Exam 3: An Overview of Long-Run Economic Growth106 Questions
Exam 4: A Model of Production128 Questions
Exam 5: The Solow Growth Model125 Questions
Exam 6: Growth and Ideas114 Questions
Exam 7: The Labor Market, Wages, and Unemployment114 Questions
Exam 8: Inflation111 Questions
Exam 9: An Introduction to the Short Run105 Questions
Exam 10: The Great Recession: a First Look104 Questions
Exam 11: The Is Curve122 Questions
Exam 12: Monetary Policy and the Phillips Curve132 Questions
Exam 13: Stabilization Policy and the Asad Framework109 Questions
Exam 14: The Great Recession and the Short-Run Model104 Questions
Exam 15: Dsge Models: the Frontier of Business Cycle Research114 Questions
Exam 16: Consumption104 Questions
Exam 17: Investment111 Questions
Exam 18: The Government and the Macroeconomy115 Questions
Exam 19: International Trade103 Questions
Exam 20: Exchange Rates and International Finance129 Questions
Exam 21: Parting Thoughts35 Questions
Select questions type
The relationship between actual output in an economy, the long-run component, and the short-run component is given as: Long-run trend = Current output + Short-run fluctuations.
(True/False)
4.8/5  (44)
(44)
Refer to the following figure when answering the next five questions.
Figure 9.2: U.S. Output Fluctuations 1960-2012 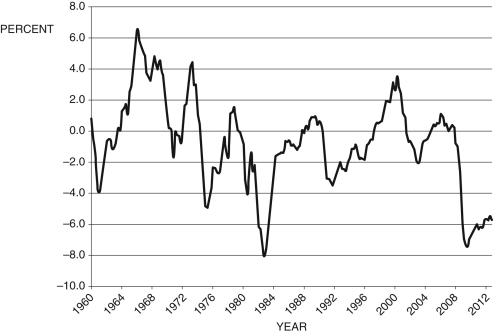 (Source: BEA and CBO, data from Federal Reserve Economic Data, St. Louis Federal Reserve)
-Consider Figure 9.2. In 1989, the U.S. economy experienced an economic ________, and current output was about ________ potential output.
(Source: BEA and CBO, data from Federal Reserve Economic Data, St. Louis Federal Reserve)
-Consider Figure 9.2. In 1989, the U.S. economy experienced an economic ________, and current output was about ________ potential output.
(Multiple Choice)
4.8/5 (32)
Generally speaking, the rate of inflation ________ during a recession.
(Multiple Choice)
4.9/5 (25)
If output is above potential, so that is positive, the change in the inflation rate will be negative, so inflation will fall over time.
(True/False)
5.0/5 (39)
According to the text, the slope of the Phillips curve in the United States is about ________. Thus, if the change in inflation is 1 percent, the gap would be ________ percent.
(Multiple Choice)
4.7/5 (28)
Figure 9.5: Economic Boom versus Recession  -In Figure 9.5, area b represents an economic boom, and area a is a recession.
(True/False)
4.7/5 (35)
Refer to the following figure when answering
Figure 9.4: U.S. Inflation 1990-2012 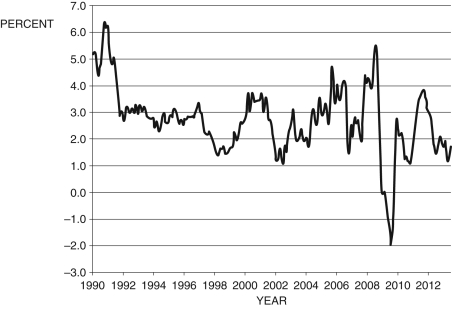 (Source: Bureau of Labor Statistics)
-Consider Figure 9.4, which shows the annual inflation rate. According to the Phillips curve, the period from about 2009 to 2010 was a period of:
(Source: Bureau of Labor Statistics)
-Consider Figure 9.4, which shows the annual inflation rate. According to the Phillips curve, the period from about 2009 to 2010 was a period of:
(Multiple Choice)
4.7/5 (28)
The short-run model is built on which of the following?
i. The economy is constantly being hit by "shocks."
ii. Economic policy has no impact on output.
iii. There is trade-off between output and inflation.
(Multiple Choice)
4.8/5 (28)
Refer to the following figure when answering
Figure 9.3: Phillips Curve 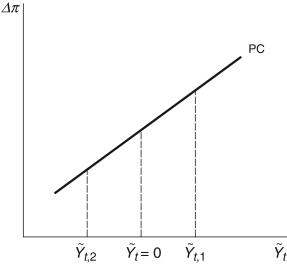 -Consider the Phillips curve at in Figure 9.3. The economy is:
(Multiple Choice)
4.8/5 (36)
Figure 9.6: The Output Gap 1980-2012 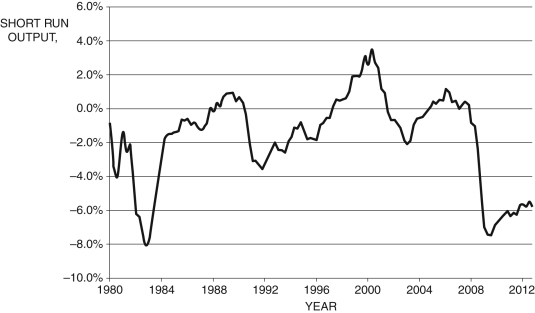 (SOURCE: Federal Reserve Economic Data, St. Louis Federal Reserve)
-Figure 9.6 above shows the output gap for the years 1980-2012. Using the Phillips curve and Okun's law, discuss the impacts on inflation and unemployment for the years 1997-2000 and 2008-2012. From this analysis, what is the relationship between unemployment and inflation?
(SOURCE: Federal Reserve Economic Data, St. Louis Federal Reserve)
-Figure 9.6 above shows the output gap for the years 1980-2012. Using the Phillips curve and Okun's law, discuss the impacts on inflation and unemployment for the years 1997-2000 and 2008-2012. From this analysis, what is the relationship between unemployment and inflation?
(Essay)
4.8/5 (38)
According to the Phillips curve presented in the text, a positive macroeconomic shock decreases the rate of inflation.
(True/False)
4.9/5 (31)
In 1979, the inflation rate reached about 14 percent, due in part to ________. The Board of Governors of the Federal Reserve under ________ decided to ________ interest rates, sending the economy into a ________.
(Multiple Choice)
4.7/5 (29)
In 1979, the inflation rate reached about 14 percent. The Federal Reserve ________ interest rates, sending the economy into a(n) ________. When doing so, the Federal Reserve knew this would be the case because of the ________.
(Multiple Choice)
4.8/5 (32)
Defining u as the unemployment rate and as the natural rate of unemployment, Okun's law is given by .
(True/False)
4.8/5 (37)
Filters
- Essay(0)
- Multiple Choice(0)
- Short Answer(0)
- True False(0)
- Matching(0)