Exam 2: Tabular and Graphical Methods
Exam 1: Statistics and Data68 Questions
Exam 2: Tabular and Graphical Methods99 Questions
Exam 3: Numerical Descriptive Measures123 Questions
Exam 4: Basic Probability Concepts107 Questions
Exam 5: Discrete Probability Distributions118 Questions
Exam 6: Continuous Probability Distributions114 Questions
Exam 7: Sampling and Sampling Distributions110 Questions
Exam 8: Interval Estimation111 Questions
Exam 9: Hypothesis Testing111 Questions
Exam 10: Statistical Inference Concerning Two Populations104 Questions
Exam 11: Statistical Inference Concerning Variance96 Questions
Exam 12: Chi-Square Tests100 Questions
Exam 13: Analysis of Variance89 Questions
Exam 14: Regression Analysis116 Questions
Exam 15: Inference With Regression Models117 Questions
Exam 16: Regression Models for Nonlinear Relationships95 Questions
Exam 17: Regression Models With Dummy Variables117 Questions
Exam 18: Time Series and Forecasting103 Questions
Exam 19: Returns, Index Numbers and Inflation98 Questions
Exam 20: Nonparametric Tests99 Questions
Select questions type
The following table shows the prices (in $1,000s)of the last 15 trucks sold at a Toyota dealership. 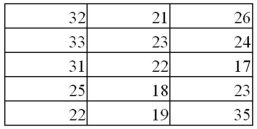 Construct a stem-and-leaf diagram.Given this diagram,estimate the price that a potential buyer would likely pay for a Toyota truck.
Free
(Essay)
4.7/5  (33)
(33)
Correct Answer: Verified
A potential buyer of a Toyota truck is likely to pay in the low to mid $20s (in thousands). 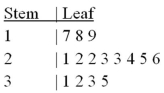
Construct a stem-and-leaf diagram for the following data set: 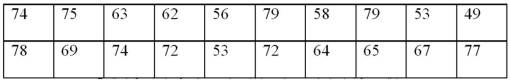 Is the distribution symmetric?
Free
(Essay)
4.9/5 (38)
Correct Answer:Verified
 No,the distribution is negatively skewed.
The following table displays the top 40 American League batting averages of the 2011 season. 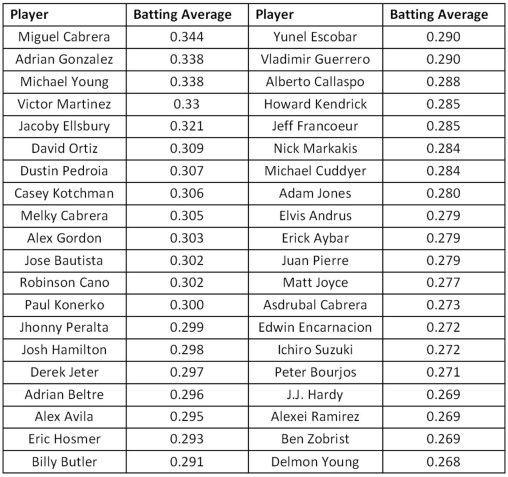 Source: http://www.espn.com
A)Construct frequency,relative frequency,and cumulative relative frequency distributions that group the data in classes of 0.265 up to 0.280,0.280 up to 0.295,0.295 up to 0.310,and so on.
B)How many of these players have a batting average above 0.340? What proportion of these players has a batting average of at least 0.280,but below 0.295? What percentage of these players has a batting average below 0.325?
C)Construct a relative frequency histogram.Is the distribution symmetric? If not,is it positively or negatively skewed?
D)Construct an ogive.
E)Using the ogive,approximately what proportion of the players in this group has a batting average above 0.290?
Source: http://www.espn.com
A)Construct frequency,relative frequency,and cumulative relative frequency distributions that group the data in classes of 0.265 up to 0.280,0.280 up to 0.295,0.295 up to 0.310,and so on.
B)How many of these players have a batting average above 0.340? What proportion of these players has a batting average of at least 0.280,but below 0.295? What percentage of these players has a batting average below 0.325?
C)Construct a relative frequency histogram.Is the distribution symmetric? If not,is it positively or negatively skewed?
D)Construct an ogive.
E)Using the ogive,approximately what proportion of the players in this group has a batting average above 0.290?
Free
(Essay)
4.8/5 (40)
Correct Answer:Verified
a. 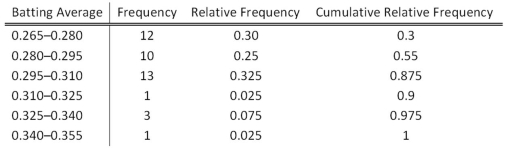
b.One player has a batting average above 0.340;0.25 of the players have a batting average of at least 0.280 but less than 0.295;90% of the players have batting averages below 0.325.
c.The distribution is not symmetric;it is positively skewed. 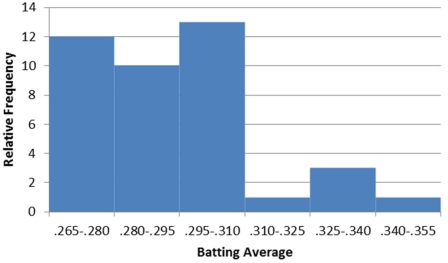
d. 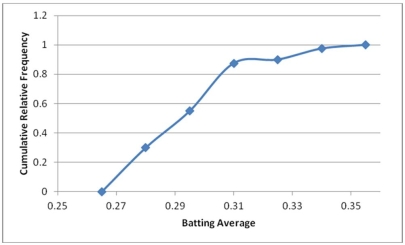 e.Approximately 0.55
Which of the following best describes a frequency distribution for qualitative data?
(Multiple Choice)
5.0/5 (38)
In order to summarize qualitative data,a useful tool is a _________.
(Multiple Choice)
4.8/5 (37)
Exhibit 2-8.Consider the following frequency distribution.  Refer to Exhibit 2-8.What proportion of the observations are less than 21?
(Multiple Choice)
4.8/5 (38)
Exhibit 2-1.An auto parts chain asked customers to complete a survey rating the chain's customer service as average,above average,or below average.The following shows the results from the survey: 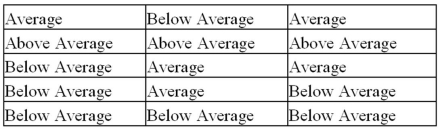 Refer to Exhibit 2-1.A rating of Average or Above Average accounted for what number of responses to the survey?
(Multiple Choice)
4.9/5 (34)
A hair stylist records the hair color of her 25 most recent appointments,classifying the color as blonde,brown,black,or red.Her data set is displayed next. 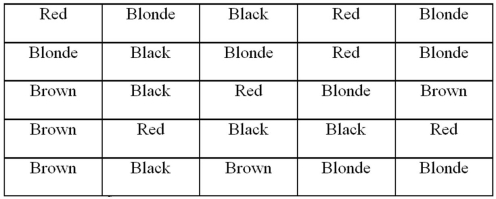 A)Construct a frequency and relative frequency distribution of the hair color of the stylist's customers.
B)Construct a pie chart.Which hair color is the most common among the stylist's customers?
C)Create a bar chart to display the frequency distribution.How many customers had black hair?
A)Construct a frequency and relative frequency distribution of the hair color of the stylist's customers.
B)Construct a pie chart.Which hair color is the most common among the stylist's customers?
C)Create a bar chart to display the frequency distribution.How many customers had black hair?
(Essay)
4.7/5 (36)
A histogram is a series of rectangles where the width and height of each rectangle represent the frequency (or relative frequency)and the width of the class,respectively.
(True/False)
4.9/5 (32)
A stem-and-leaf diagram is useful in that it gives an overall picture of where quantitative data are centered and how the data are dispersed from the center.
(True/False)
4.8/5 (28)
Each month the Bureau of Labor Statistics reports the number of people (in thousands)employed in the United States by age.The accompanying frequency distribution shows the results for August 2011 (Source: http://data.bls.gov/pdq/SurveyOutputServlet). 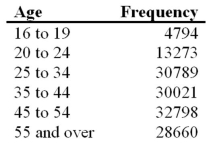 a.Construct a relative frequency distribution.What proportion of workers is between 20 and 24 years old?
B)Construct a cumulative relative frequency distribution.What proportion of workers is younger than 35 years old?
C)Construct a relative frequency histogram.
a.Construct a relative frequency distribution.What proportion of workers is between 20 and 24 years old?
B)Construct a cumulative relative frequency distribution.What proportion of workers is younger than 35 years old?
C)Construct a relative frequency histogram.
(Essay)
4.8/5 (39)
Exhibit 2-8.Consider the following frequency distribution. 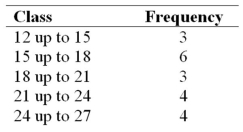 Refer to Exhibit 2-8.What proportion of the observations are at least 15 but less than 18?
(Multiple Choice)
4.9/5 (27)
The following table lists some of the busiest ports in the world based on the number of containers in 2010.
(Essay)
4.9/5 (34)
The following table shows average wind speeds (in miles per hour)during 15 major fires in California. 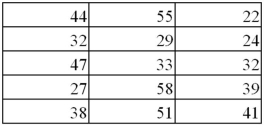 Construct a stem-and-leaf diagram.Were most of these storms fueled by 45+ mile-per-hour winds? Explain.
(Essay)
4.9/5 (31)
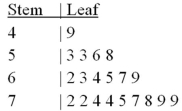
Exhibit 2-14.In the accompanying stem-and-leaf diagram,the values in the stem and leaf portions represent 10s and 1s digits,respectively. 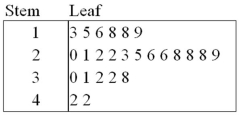 Refer to Exhibit 2-14.What would be the frequency of the class 35 up to 45,that is {x;35 ≤ x < 45}?
(Multiple Choice)
4.9/5 (30)
The following histogram represents the number of pages in each book within a collection.What is the frequency of books containing at least 250 but less than 300 pages? 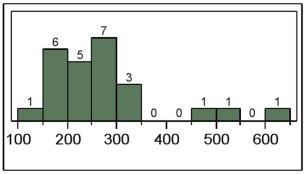
(Multiple Choice)
4.7/5 (40)
The following table shows the number of payroll jobs the government added during the years its added jobs (since 1973).The jobs are in thousands. 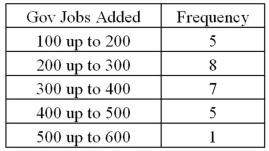 Approximately what percent of the time did the government add 200,000 or more jobs?
(Multiple Choice)
4.8/5 (35)
Exhibit 2-14.In the accompanying stem-and-leaf diagram,the values in the stem and leaf portions represent 10s and 1s digits,respectively.  Refer to Exhibit 2-14.The stem-and-leaf diagram shows that the distribution is __________.
(Multiple Choice)
4.8/5 (36)
Exhibit 2-4.Students in Professor Smith's Business Statistics course have evaluated the overall effectiveness of the professor's instruction on a five-point scale,where a score of 1 indicates very poor performance and a score of 5 indicates outstanding performance.The raw scores are displayed in the accompanying table: 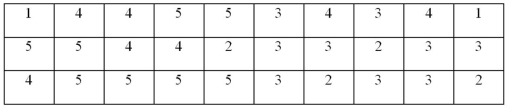 Refer to Exhibit 2-4.What percentage of students gave Professor Smith an evaluation of 2 or less?
(Multiple Choice)
4.9/5 (34)
To approximate the width of a class in the creation of a bar chart,we may use this formula: 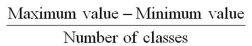 .
.
(True/False)
4.9/5 (37)
Filters
- Essay(0)
- Multiple Choice(0)
- Short Answer(0)
- True False(0)
- Matching(0)