Exam 11: Statistical Inference Concerning Variance
Exam 1: Statistics and Data68 Questions
Exam 2: Tabular and Graphical Methods99 Questions
Exam 3: Numerical Descriptive Measures123 Questions
Exam 4: Basic Probability Concepts107 Questions
Exam 5: Discrete Probability Distributions118 Questions
Exam 6: Continuous Probability Distributions114 Questions
Exam 7: Sampling and Sampling Distributions110 Questions
Exam 8: Interval Estimation111 Questions
Exam 9: Hypothesis Testing111 Questions
Exam 10: Statistical Inference Concerning Two Populations104 Questions
Exam 11: Statistical Inference Concerning Variance96 Questions
Exam 12: Chi-Square Tests100 Questions
Exam 13: Analysis of Variance89 Questions
Exam 14: Regression Analysis116 Questions
Exam 15: Inference With Regression Models117 Questions
Exam 16: Regression Models for Nonlinear Relationships95 Questions
Exam 17: Regression Models With Dummy Variables117 Questions
Exam 18: Time Series and Forecasting103 Questions
Exam 19: Returns, Index Numbers and Inflation98 Questions
Exam 20: Nonparametric Tests99 Questions
Select questions type
The values of the  distribution range from negative infinity to infinity.
Free
(True/False)
4.9/5  (33)
(33)
Correct Answer: Verified
False
If P(  ≥ x)= 0.05,then the value of x is ____.
Free
(Multiple Choice)
4.9/5 (26)
Correct Answer:Verified
C
The null hypothesis  is rejected if the value of the test statistic exceeds
  .
.
Free
(True/False)
4.8/5 (35)
Correct Answer:Verified
True
Which of the following factors is used to conduct hypothesis tests regarding the population variance?
(Multiple Choice)
4.7/5 (35)
Exhibit 11-3.The following are the competing hypotheses and the relevant summary statistics.  Sample 1:
  n1 = 10 Sample 2:
  n2 = 9
Refer to Exhibit 11-3.Which of the following statements is true with regard to the assumptions for conducting the hypothesis test?
n2 = 9
Refer to Exhibit 11-3.Which of the following statements is true with regard to the assumptions for conducting the hypothesis test?
(Multiple Choice)
4.8/5 (43)
Exhibit 11-5.Amie Jackson,a manager at Sigma travel services,makes every effort to ensure that customers attempting to make online reservations do not have to wait too long to complete the reservation process.The travel website is open for reservations 24 hours a day,and Amie regularly checks the website for the waiting time to maintain consistency in service.She uses the following independently drawn samples of wait time during two peak hours,morning 8 am to 10 am and evening 7 pm to 9 pm,for the analysis.Assume that wait times are normally distributed. 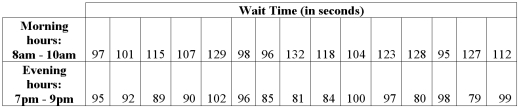 Refer to Exhibit 11-5.Compute the value of the test statistic.
(Multiple Choice)
4.7/5 (37)
(Use Excel)The following are the prices (in $1,000s)of 20 houses sold recently in Vancouver,Washington.A real estate agent believes that the standard deviation of house prices is less than 70 units,where each unit equals $1,000.Assume house prices are normally distributed.  a.State the null and the alternative hypotheses for the test.
B)Calculate the value of the test statistic.
C)Use Excel's function (either CHISQ.DIST.RT or CHISQ.DIST)to calculate the p-value.
D)At α = 0.10 what is the conclusion? Is the agent's claim supported by the data?
a.State the null and the alternative hypotheses for the test.
B)Calculate the value of the test statistic.
C)Use Excel's function (either CHISQ.DIST.RT or CHISQ.DIST)to calculate the p-value.
D)At α = 0.10 what is the conclusion? Is the agent's claim supported by the data?
(Essay)
4.9/5 (34)
The parameter of interest for inferences regarding the ratio of two population variances is their sum  .
.
(True/False)
4.8/5 (33)
Exhibit 11-6.A financial analyst examines the performance of two mutual funds and claims that the variances of the annual returns for the bond funds differ.To support his claim,he collects data on the annual returns (in percent)for the years 2001 through 2010.The analyst assumes that the annual returns for the two emerging market bond funds are normally distributed.Here are some relevant summary statistics. 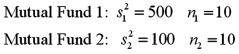 Refer to Exhibit 4-6.At α = 0.10,is the analyst's claim supported by the data?
(Multiple Choice)
4.8/5 (37)
The following are the measures based on independently drawn samples from normally distributed populations:
Sample 1:  = 345,and n1 = 25
Sample 2:
= 345,and n1 = 25
Sample 2:  = 276,and n2 = 21
A)Construct a 90% interval estimate of the ratio of the population variances.
B)Test if the ratio of the population variances differs from 1,using the computed confidence interval,at the 10% significance level.
= 276,and n2 = 21
A)Construct a 90% interval estimate of the ratio of the population variances.
B)Test if the ratio of the population variances differs from 1,using the computed confidence interval,at the 10% significance level.
(Short Answer)
4.8/5 (32)
Exhibit 11-6.A financial analyst examines the performance of two mutual funds and claims that the variances of the annual returns for the bond funds differ.To support his claim,he collects data on the annual returns (in percent)for the years 2001 through 2010.The analyst assumes that the annual returns for the two emerging market bond funds are normally distributed.Here are some relevant summary statistics.  Refer to Exhibit 11-6.For the competing hypotheses:
  since
since  ,approximate the p-value for the test.
(Multiple Choice)
4.9/5 (44)
A professor analyzes the variance in scores between two sections that he teaches.The students of each section took the same test.The random samples drawn from the observations yield sample variances of  = 203.15 and
  = 474.42 for samples of n1 = 13 and n2 = 16,respectively.Construct a 99% confidence interval for the ratio of the population variances.
(Multiple Choice)
4.8/5 (26)
Construct a 95% confidence interval for the ratios of two population variances.The random samples of n1 = 9 and n2 = 11 with sample variances of  and
and  ,respectively.Assume that the samples were drawn from a normal population.
(Multiple Choice)
4.8/5 (29)
Use the p-value approach to conduct the following left-tailed hypothesis test at the 10% significance level.Assume that the two populations are normally distributed. ![Use the p-value approach to conduct the following left-tailed hypothesis test at the 10% significance level.Assume that the two populations are normally distributed. Sample 1: = 15.7, = 0.77,and n<sub>1</sub> = 11 Sample 2: = 19.2, = 0.82,and n<sub>2</sub> = 13 [Hint: You may want to first convert the above left-tailed test into a right-tailed test by switching the two variances.]](https://storage.examlex.com/TB2339/11eaa4ae_7ab5_2d16_9180_b1f07274116c_TB2339_00.jpg)
![Use the p-value approach to conduct the following left-tailed hypothesis test at the 10% significance level.Assume that the two populations are normally distributed. Sample 1: = 15.7, = 0.77,and n<sub>1</sub> = 11 Sample 2: = 19.2, = 0.82,and n<sub>2</sub> = 13 [Hint: You may want to first convert the above left-tailed test into a right-tailed test by switching the two variances.]](https://storage.examlex.com/TB2339/11eaa4ae_7ab5_2d17_9180_7dfcf3b56b68_TB2339_00.jpg) Sample 1:
Sample 1: ![Use the p-value approach to conduct the following left-tailed hypothesis test at the 10% significance level.Assume that the two populations are normally distributed. Sample 1: = 15.7, = 0.77,and n<sub>1</sub> = 11 Sample 2: = 19.2, = 0.82,and n<sub>2</sub> = 13 [Hint: You may want to first convert the above left-tailed test into a right-tailed test by switching the two variances.]](https://storage.examlex.com/TB2339/11eaa4ae_7ab5_2d18_9180_35241aa48c2c_TB2339_11.jpg) = 15.7,
= 15.7, ![Use the p-value approach to conduct the following left-tailed hypothesis test at the 10% significance level.Assume that the two populations are normally distributed. Sample 1: = 15.7, = 0.77,and n<sub>1</sub> = 11 Sample 2: = 19.2, = 0.82,and n<sub>2</sub> = 13 [Hint: You may want to first convert the above left-tailed test into a right-tailed test by switching the two variances.]](https://storage.examlex.com/TB2339/11eaa4ae_7ab5_2d19_9180_b522f0535903_TB2339_11.jpg) = 0.77,and n1 = 11
Sample 2:
= 0.77,and n1 = 11
Sample 2: ![Use the p-value approach to conduct the following left-tailed hypothesis test at the 10% significance level.Assume that the two populations are normally distributed. Sample 1: = 15.7, = 0.77,and n<sub>1</sub> = 11 Sample 2: = 19.2, = 0.82,and n<sub>2</sub> = 13 [Hint: You may want to first convert the above left-tailed test into a right-tailed test by switching the two variances.]](https://storage.examlex.com/TB2339/11eaa4ae_7ab5_2d1a_9180_f574545e4d3a_TB2339_11.jpg) = 19.2,
= 19.2, ![Use the p-value approach to conduct the following left-tailed hypothesis test at the 10% significance level.Assume that the two populations are normally distributed. Sample 1: = 15.7, = 0.77,and n<sub>1</sub> = 11 Sample 2: = 19.2, = 0.82,and n<sub>2</sub> = 13 [Hint: You may want to first convert the above left-tailed test into a right-tailed test by switching the two variances.]](https://storage.examlex.com/TB2339/11eaa4ae_7ab5_542b_9180_436b4681775e_TB2339_11.jpg) = 0.82,and n2 = 13
[Hint: You may want to first convert the above left-tailed test into a right-tailed test by switching the two variances.]
= 0.82,and n2 = 13
[Hint: You may want to first convert the above left-tailed test into a right-tailed test by switching the two variances.]
(Essay)
4.9/5 (34)
Which of the following Excel functions is used to determine the left-tailed  value given any probability?
(Multiple Choice)
5.0/5 (34)
A right-tailed test for the ratio of two population variances  examines whether
  is greater than
  .
.
(True/False)
4.7/5 (22)
If s2 is computed from a random sample of n observations drawn from an underlying normal population with a finite variance,then the  variable is defined as ____.
(Multiple Choice)
4.9/5 (46)
Filters
- Essay(0)
- Multiple Choice(0)
- Short Answer(0)
- True False(0)
- Matching(0)