Exam 2: Functions
Exam 1: Fundamentals229 Questions
Exam 2: Functions98 Questions
Exam 3: Polynomial and Rational Functions145 Questions
Exam 4: Exponential and Logarithmic Functions99 Questions
Exam 5: Trigonometric Functions: Unit Circle Approach100 Questions
Exam 6: Trigonometric Functions: Right Triangle Approach119 Questions
Exam 7: Analytic Trigonometry119 Questions
Exam 8: Polar Coordinates and Parametric Equations109 Questions
Exam 9: Vectors in Two and Three Dimensions96 Questions
Exam 10: Systems of Equations and Inequalities140 Questions
Exam 11: Conic Sections99 Questions
Exam 12: Sequences and Series100 Questions
Exam 13: Limits: a Preview of Calculus66 Questions
Select questions type
State whether the curve is the graph of a function. If it is, state the domain and range of the function. 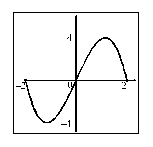
(Multiple Choice)
4.8/5  (34)
(34)
The graph of a function is given. Determine the average rate of change of the function between the indicated points on the graph. 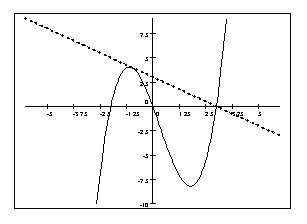
(Essay)
4.8/5 (41)
Suppose that the total cost (in thousands of dollars) to produce units (in millions) of a particular product is given by the function .
(a) Find
 .
(b) Find
.
(b) Find
 . What does your answer represent?
(Essay)
4.9/5 (31)
Shift the graph of by units to the left and then units downward, and choose the equation for the final transformed graph.
(Multiple Choice)
4.8/5 (33)
Determine if the equation defines as a function of . Explain your answer.
(Essay)
4.8/5 (34)
Given the graph of describe how the graph of can be obtained from the graph of
(Multiple Choice)
4.9/5 (42)
For the function determine the average rate of change between the values and .
(Essay)
4.9/5 (30)
For the function determine the average rate of change between the values and .
(Essay)
4.7/5 (29)
Let . Graph the family of functions with , , , , and in the viewing rectangle by . How does the value of affect the graph?
(Essay)
4.9/5 (36)
For the function determine the average rate of change between the values and ( ).
(Essay)
4.8/5 (37)
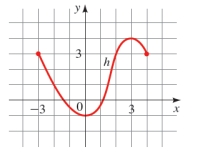
The graph of a function h is given.
(a) Find
(b) Find the domain and range of h.
(c) Find the values of x for which
(d) Find the values of x for which
(Essay)
4.7/5 (39)
The graph of a function is given. Find the intervals on which the function is increasing and decreasing. 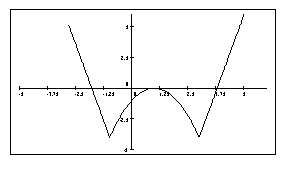
(Multiple Choice)
4.8/5 (43)
The graph shows the depth of water W in a reservoir over a one-year period as a function of the number of days x since the beginning of the year. What was the average rate of change of W between x = 0 and x= 100?
(Essay)
4.8/5 (40)
Determine whether the given curve is the graph of a function of . If it is, state the domain and range of the function. 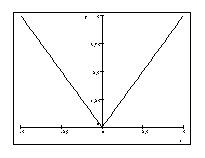
(Multiple Choice)
4.7/5 (29)
A function is given. Use a graphing calculator to draw the graph of f. Find the domain and range of f from the graph.
(Essay)
4.9/5 (34)
Graph the given functions on the same screen using the viewing rectangle by . How is each part related to the graph in part
(a)
(a)?
(b)
(c)
(d)
(Essay)
4.9/5 (34)
A function is given.
(a) Find all the local maximum and minimum values of the function and the value of x at which each occurs.
(b) Find the intervals on which the function is increasing and on which the function is decreasing. State all answers correct to two decimal places.
(Essay)
4.8/5 (35)
Filters
- Essay(0)
- Multiple Choice(0)
- Short Answer(0)
- True False(0)
- Matching(0)