Exam 13: Multiple Regression Analysis
Exam 1: Introduction to Statistics86 Questions
Exam 2: Charts and Graphs55 Questions
Exam 3: Descriptive Statistics59 Questions
Exam 4: Probability76 Questions
Exam 5: Discrete Distributions81 Questions
Exam 6: Continuous Distributions83 Questions
Exam 7: Sampling and Sampling Distributions87 Questions
Exam 8: Statistical Inference: Estimation for Single Populations82 Questions
Exam 9: Statistical Inference: Hypothesis Testing for Single Populations85 Questions
Exam 10: Statistical Inferences About Two Populations81 Questions
Exam 11: Analysis of Variance and Design of Experiments90 Questions
Exam 12: Simple Regression Analysis and Correlation98 Questions
Exam 13: Multiple Regression Analysis85 Questions
Exam 14: Building Multiple Regression Models78 Questions
Exam 15: Time-Series Forecasting and Index Numbers75 Questions
Exam 16: Analysis of Categorical Data77 Questions
Exam 17: Nonparametric Statistics76 Questions
Exam 18: Statistical Quality Control68 Questions
Exam 19: Decision Analysis79 Questions
Select questions type
In the model y = 0 + 1x1 + 2x2 + 3x3 + ,y is the independent variable.
(True/False)
4.8/5  (32)
(32)
In a multiple regression analysis with N observations and k independent variables,the degrees of freedom for the residual error is given by (N - k - 1).
(True/False)
4.8/5 (46)
A real estate appraiser is developing a regression model to predict the market value of single family residential houses as a function of heated area,number of bedrooms,number of bathrooms,age of the house,and central heating (yes,no).The "central heating" variable in this model is _______.
(Multiple Choice)
4.9/5 (31)
A multiple regression analysis produced the following tables. 
 The sample size for this analysis is ____________.
(Multiple Choice)
4.8/5 (32)
A multiple regression analysis produced the following tables. 
 The coefficient of multiple determination is ____________.
(Multiple Choice)
4.8/5 (33)
A multiple regression analysis produced the following tables.  The sample size for this analysis is ____________.
(Multiple Choice)
4.8/5 (41)
The F value that is used to test for the overall significance of a multiple regression model is calculated by dividing the sum of mean squares regression (SSreg)by the sum of squares error (SSerr).
(True/False)
4.8/5 (31)
A cost accountant is developing a regression model to predict the total cost of producing a batch of printed circuit boards as a linear function of batch size (the number of boards produced in one lot or batch),production plant (Kingsland,and Yorktown),and production shift (day,and evening).In this model,"batch size" is ______.
(Multiple Choice)
4.8/5 (36)
The following ANOVA table is from a multiple regression analysis with n = 35 and four independent variables.  The adjusted R2 value is __________.
(Multiple Choice)
4.8/5 (36)
A multiple regression analysis produced the following tables. 
 Using = 0.01 to test the null hypothesis H0: 2 = 0,the critical t value is ____.
(Multiple Choice)
4.9/5 (32)
The value of adjusted R2 always goes up when a nontrivial explanatory variable is added to a regression model.
(True/False)
4.7/5 (27)
A multiple regression analysis produced the following tables. 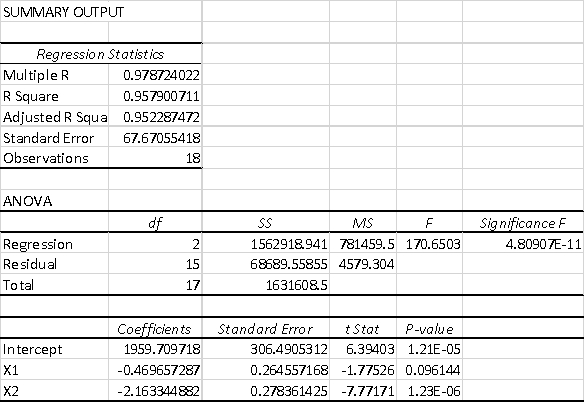 For x1= 360 and x2 = 220,the predicted value of y is ____________.
(Multiple Choice)
4.8/5 (29)
A multiple regression analysis produced the following tables. 
 Using = 0.05 to test the null hypothesis H0: 1 = 2 = 0,the critical F value is ____.
(Multiple Choice)
4.8/5 (33)
The F test is used to determine whether the overall regression model is significant.
(True/False)
4.9/5 (37)
The following ANOVA table is from a multiple regression analysis with n = 35 and four independent variables.  The number of degrees of freedom for regression is __________.
(Multiple Choice)
4.8/5 (38)
The standard error of the estimate of a multiple regression model is essentially the standard deviation of the residuals for the regression model.
(True/False)
4.8/5 (29)
A multiple regression analysis produced the following tables. 
 Using = 0.10 to test the null hypothesis H0: 2 = 0,the critical t value is ____.
(Multiple Choice)
4.8/5 (28)
A multiple regression analysis produced the following tables. 
 The regression equation for this analysis is ____________.
(Multiple Choice)
4.8/5 (43)
A multiple regression analysis produced the following tables. 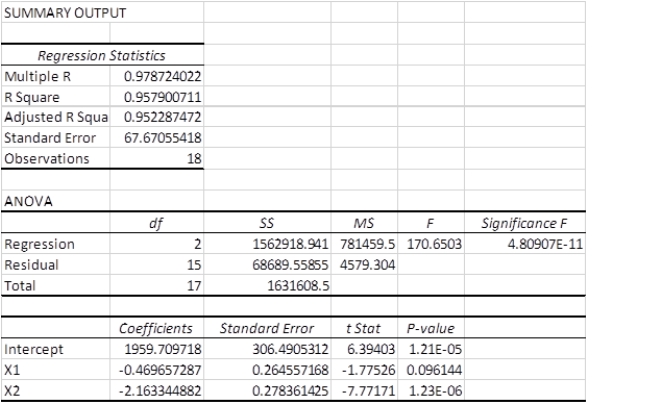 Using = 0.05 to test the null hypothesis H0: 1 = 0,the correct decision is ____.
(Multiple Choice)
5.0/5 (32)
A multiple regression analysis produced the following tables. 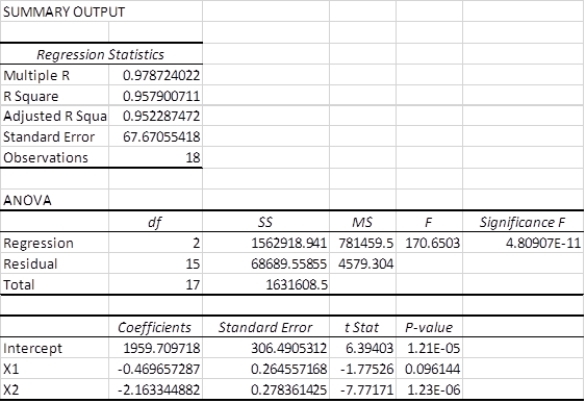 The regression equation for this analysis is ____________.
(Multiple Choice)
4.8/5 (31)
Filters
- Essay(0)
- Multiple Choice(0)
- Short Answer(0)
- True False(0)
- Matching(0)