Exam 13: Multiple Regression Analysis
Exam 1: Introduction to Statistics86 Questions
Exam 2: Charts and Graphs55 Questions
Exam 3: Descriptive Statistics59 Questions
Exam 4: Probability76 Questions
Exam 5: Discrete Distributions81 Questions
Exam 6: Continuous Distributions83 Questions
Exam 7: Sampling and Sampling Distributions87 Questions
Exam 8: Statistical Inference: Estimation for Single Populations82 Questions
Exam 9: Statistical Inference: Hypothesis Testing for Single Populations85 Questions
Exam 10: Statistical Inferences About Two Populations81 Questions
Exam 11: Analysis of Variance and Design of Experiments90 Questions
Exam 12: Simple Regression Analysis and Correlation98 Questions
Exam 13: Multiple Regression Analysis85 Questions
Exam 14: Building Multiple Regression Models78 Questions
Exam 15: Time-Series Forecasting and Index Numbers75 Questions
Exam 16: Analysis of Categorical Data77 Questions
Exam 17: Nonparametric Statistics76 Questions
Exam 18: Statistical Quality Control68 Questions
Exam 19: Decision Analysis79 Questions
Select questions type
Regression analysis with two dependent variables and two or more independent variables is called multiple regression.
(True/False)
4.8/5  (43)
(43)
The model y = 0 + 1x1 + 2x2 + 3x3 + is a first-order regression model.
(True/False)
4.7/5 (31)
A multiple regression analysis produced the following output from Minitab. Regression Analysis: Y versus x1 and x2
 S = 0.179449 R-Sq = 89.0% R-Sq(adj) = 87.8%
Analysis of Variance
S = 0.179449 R-Sq = 89.0% R-Sq(adj) = 87.8%
Analysis of Variance
 These results indicate that ____________.
(Multiple Choice)
4.9/5 (36)
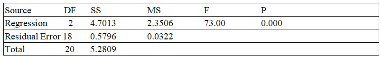
The following ANOVA table is from a multiple regression analysis with n = 35 and four independent variables.  The observed F value is __________.
(Multiple Choice)
4.9/5 (35)
The mean square error (MSerr)is calculated by dividing the sum of squares error (SSerr)by the number of error degrees of freedom (dferr).
(True/False)
4.8/5 (39)
The following ANOVA table is from a multiple regression analysis with n = 35 and four independent variables.  The R2 value is __________.
(Multiple Choice)
4.8/5 (39)
The following ANOVA table is from a multiple regression analysis.  The MSR value is __________.
(Multiple Choice)
5.0/5 (30)
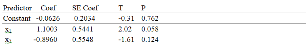
A multiple regression analysis produced the following tables.  These results indicate that ____________.
(Multiple Choice)
4.8/5 (33)
The model y = 0 + 1x1 + 2x2 + is a second-order regression model.
(True/False)
4.8/5 (30)
In a multiple regression analysis with N observations and k independent variables,the degrees of freedom for the residual error is given by (N - k).
(True/False)
4.8/5 (29)
The following ANOVA table is from a multiple regression analysis with n = 35 and four independent variables.  The value of the standard error of the estimate se is __________.
(Multiple Choice)
4.8/5 (38)
The following ANOVA table is from a multiple regression analysis.  The SSE value is __________.
(Multiple Choice)
4.8/5 (29)
The mean square error (MSerr)is calculated by dividing the sum of squares error (SSerr)by the number of observations in the data set (N).
(True/False)
4.8/5 (32)
A multiple regression analysis produced the following tables. 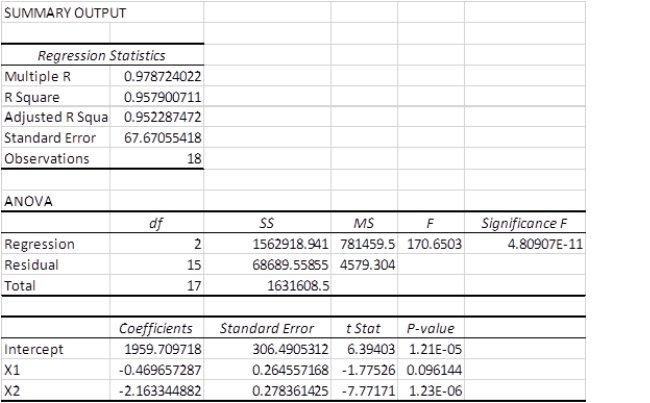 Using = 0.05 to test the null hypothesis H0: 2 = 0,the correct decision is ____.
(Multiple Choice)
5.0/5 (36)
A real estate appraiser is developing a regression model to predict the market value of single family residential houses as a function of heated area,number of bedrooms,number of bathrooms,age of the house,and central heating (yes,no).The response variable in this model is _______.
(Multiple Choice)
4.8/5 (29)
A multiple regression analysis produced the following tables. 
 The sample size for this analysis is ____________.
(Multiple Choice)
4.8/5 (32)
In regression analysis,outliers may be identified by examining the ________.
(Multiple Choice)
4.8/5 (42)
The following ANOVA table is from a multiple regression analysis.  The sample size for the analysis is __________.
(Multiple Choice)
4.9/5 (26)
A multiple regression analysis produced the following tables. 
 These results indicate that ____________.
(Multiple Choice)
4.9/5 (26)
If we reject H0: β1= β2=0 using the F-test,then we should conclude that both slopes are different from zero.
(True/False)
4.7/5 (28)
Filters
- Essay(0)
- Multiple Choice(0)
- Short Answer(0)
- True False(0)
- Matching(0)