Exam 13: Multiple Regression Analysis
Exam 1: Introduction to Statistics86 Questions
Exam 2: Charts and Graphs55 Questions
Exam 3: Descriptive Statistics59 Questions
Exam 4: Probability76 Questions
Exam 5: Discrete Distributions81 Questions
Exam 6: Continuous Distributions83 Questions
Exam 7: Sampling and Sampling Distributions87 Questions
Exam 8: Statistical Inference: Estimation for Single Populations82 Questions
Exam 9: Statistical Inference: Hypothesis Testing for Single Populations85 Questions
Exam 10: Statistical Inferences About Two Populations81 Questions
Exam 11: Analysis of Variance and Design of Experiments90 Questions
Exam 12: Simple Regression Analysis and Correlation98 Questions
Exam 13: Multiple Regression Analysis85 Questions
Exam 14: Building Multiple Regression Models78 Questions
Exam 15: Time-Series Forecasting and Index Numbers75 Questions
Exam 16: Analysis of Categorical Data77 Questions
Exam 17: Nonparametric Statistics76 Questions
Exam 18: Statistical Quality Control68 Questions
Exam 19: Decision Analysis79 Questions
Select questions type
A multiple regression analysis produced the following tables. 
 The regression equation for this analysis is ____________.
(Multiple Choice)
4.8/5  (32)
(32)
In a multiple regression model,the partial regression coefficient of an independent variable represents the increase in the y variable when that independent variable is increased by one unit if the values of all other independent variables are held constant.
(True/False)
4.9/5 (40)
A multiple regression analysis produced the following output from Excel. 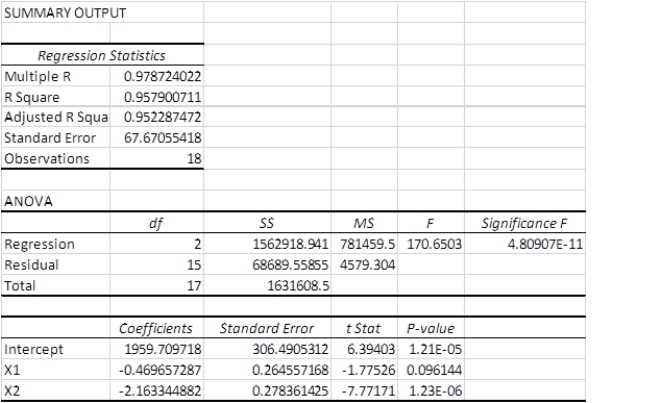 The overall proportion of variation of y accounted by x1 and x2 is _______
(Multiple Choice)
4.8/5 (41)
A market analyst is developing a regression model to predict monthly household expenditures on groceries as a function of family size,household income,and household neighborhood (urban,suburban,and rural).The "income" variable in this model is ____.
(Multiple Choice)
4.8/5 (31)
Minitab and Excel output for a multiple regression model show the F test for the overall model,but do not provide the t tests for the regression coefficients.
(True/False)
5.0/5 (32)
The following ANOVA table is from a multiple regression analysis.  The R2 value is __________.
(Multiple Choice)
4.8/5 (39)
A market analyst is developing a regression model to predict monthly household expenditures on groceries as a function of family size,household income,and household neighborhood (urban,suburban,and rural).The response variable in this model is _____.
(Multiple Choice)
4.7/5 (32)
Multiple t-tests are used to determine whether the independent variables in the regression model are significant.
(True/False)
4.9/5 (33)
The F value that is used to test for the overall significance of a multiple regression model is calculated by dividing the mean square regression (MSreg)by the mean square error (MSerr).
(True/False)
4.9/5 (39)
A human resources analyst is developing a regression model to predict electricity production plant manager compensation as a function of production capacity of the plant,number of employees at the plant,and plant technology (coal,oil,and nuclear).The "number of employees at the plant" variable in this model is ______.
(Multiple Choice)
4.7/5 (29)
The standard error of the estimate of a multiple regression model is computed by taking the square root of the mean squares of error.
(True/False)
4.9/5 (23)
A multiple regression analysis produced the following tables. 
 Using = 0.01 to test the null hypothesis H0: 1 = 2 = 0,the critical F value is ____.
(Multiple Choice)
4.8/5 (35)
The following ANOVA table is from a multiple regression analysis with n = 35 and four independent variables.  The MSE value is __________.
(Multiple Choice)
4.8/5 (32)
A multiple regression analysis produced the following tables. 
 The coefficient of multiple determination is ____________.
(Multiple Choice)
4.9/5 (35)
A multiple regression analysis produced the following tables. 
 Using = 0.01 to test the null hypothesis H0: 1 = 2 = 0,the critical F value is ____.
(Multiple Choice)
4.7/5 (43)
A multiple regression analysis produced the following output from Excel.  The correlation coefficient is ____________.
(Multiple Choice)
4.8/5 (30)
The following ANOVA table is from a multiple regression analysis.  The number of independent variables in the analysis is __________.
(Multiple Choice)
4.9/5 (33)
A multiple regression analysis produced the following output from Excel.  The coefficient of multiple determination is ____________.
(Multiple Choice)
4.8/5 (40)
The following ANOVA table is from a multiple regression analysis.  The observed F value is __________.
(Multiple Choice)
4.7/5 (32)
In a multiple regression model,the proportion of the variation of the dependent variable,y,accounted for the independent variables in the regression model is given by the coefficient of multiple correlation.
(True/False)
4.8/5 (27)
Filters
- Essay(0)
- Multiple Choice(0)
- Short Answer(0)
- True False(0)
- Matching(0)